Transform your data into valuable insights
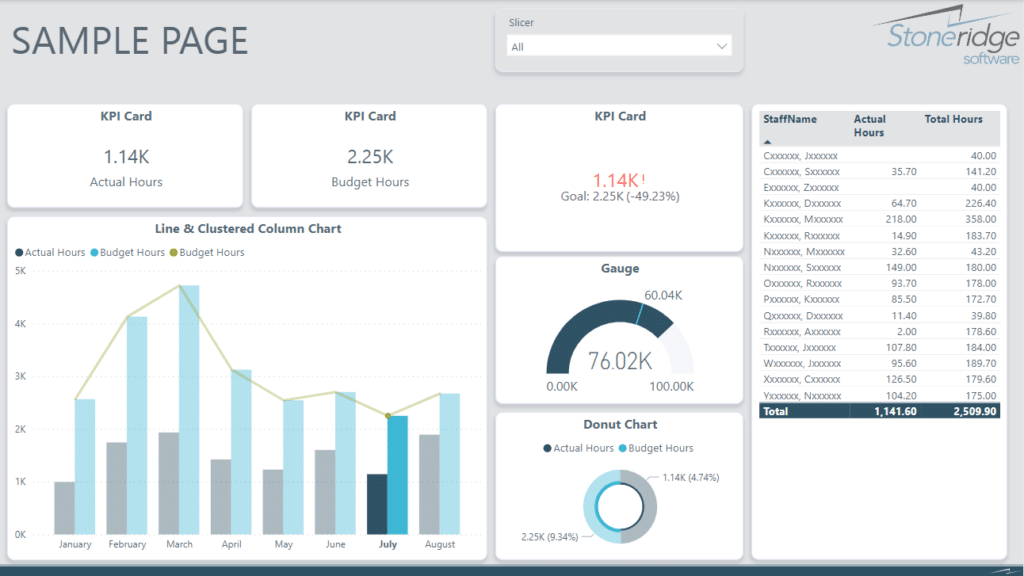
Power BI is a set of analytics tools to help you create rich, interactive reports with modern data visualizations for better insights and quicker decision-making capabilities. BI can be implemented in many different ways, across industries and departments, and is viewable anyway, anywhere. Power BI enables you to prep and model your data with ease and create visual analytics no matter where your data resides (SQL Server, Dynamics 365, Excel, etc.)
Power BI Services
Implementations | Workshops | Reporting | BI Strategy and Roadmaps | Managed-Self Service BI
Data Warehouse Implementation | Data Migration and Integration
Power BI for Financial Reporting: Key Benefits
Power BI’s financial reporting packs a powerful tool for businesses looking to enhance their financial analysis and reporting capabilities. They not only improve the aesthetics of financial reports but also their functionality, making financial data more accessible and actionable.
- Visually Stunning Reports: Create reports that are both beautiful and functional, making data analysis a visual treat.
- Interactive Data Exploration: Dive deep into the numbers with interactive features that reveal the story behind the data.
- Seamless Data Integration: Effortlessly combine data from various sources for a comprehensive financial view.
- Customizable Themes: Tailor your financial reports to reflect your brand and focus on what matters most.
- User Accessibility: Power BI’s intuitive design makes advanced data analysis accessible to all.
- Advanced Analytics: Leverage powerful analytics for a deeper understanding of financial trends and patterns.
- Time-Saving Automation: Utilize automated reporting to generate insights quickly and efficiently.
- Informed Decision-Making: Transform data into actionable insights to guide strategic business decisions.
- Regulatory Compliance: Ensure accuracy and reliability in your financial reporting, meeting all compliance standards.

Power BI for Company & Departmental Dashboards: Core Advantages
The essence of Power BI’s dashboard capabilities show how it can revolutionize the way you visualize and interact with your data.
- Unified Data View: Centralize data from multiple departments for a cohesive and comprehensive dashboard experience.
- Real-Time Insights: Monitor key metrics as they happen, enabling swift and informed responses to business changes.
- Collaborative Environment: Share insights easily across teams, enhancing communication and strategic alignment.
- Scalability: Grow your dashboard capabilities in tandem with your business, ensuring long-term adaptability.
- Data-Driven Culture: Foster a culture of analytics by making data insights accessible to decision-makers at all levels.
- Security and Governance: Maintain control over your data with robust security features and governance protocols.
- Streamlined Reporting: Simplify the reporting process with automated data refreshes and up-to-date analytics.
- Customization and Personalization: Create dashboards that resonate with your brand and meet specific user needs.
- Strategic Planning Support: Utilize forecasting and trend analysis to support strategic planning and future growth.
“It’s, by far, the most widely-used service that we use inside the company other than Office 365 email. Everyone is using Power BI to run their businesses.”
James Phillips, Corporate VP & Power BI Head, Microsoft
Power BI Workshop by Stoneridge: Enhancing BI Capabilities
Stoneridge provides a structured approach and comprehensive benefits of utilizing helping you realize the value Power BI and gives you a jump start on your business intelligence strategy. Stoneridge resources can enhance your understanding of and potential uses of Power BI through discovery with you and your team to uncover BI needs, define and finalize use cases (dashboards/reports), data sources. creating a dashboard that your organization uses Power BI development experience by connecting to your data sources and creating a dashboard identified by your subject matter experts (SMEs). Stoneridge will work with your SMEs to define the requirements for dashboard development and specific KPIs that need to be included on the dashboard.
- Tailored Discovery: Collaborate with your team to identify and understand your unique BI needs and potential applications of Power BI.
- Use Case Definition: Work together to define and finalize specific use cases for dashboards and reports that will drive your business forward.
- Data Source Connection: Connect to your organization’s data sources, leveraging Stoneridge’s Power BI development expertise.
- Expert-Led Dashboard Creation: Create impactful dashboards guided by the insights of your subject matter experts (SMEs).
- Requirement Specification: Define clear requirements for dashboard development, ensuring all essential KPIs are included.
- Interactive Learning: Engage in hands-on sessions to learn the ins and outs of Power BI dashboard creation and management.
- Strategic Insight: Gain strategic insights into how Power BI can be used to visualize and analyze your company’s data effectively.
- Actionable Outcomes: Leave the workshop with actionable knowledge and a prototype dashboard tailored to your business objectives.
Ready to transform your data with Power BI?
Featured Power BI Success Stories
Nonprofit Adopts Microsoft Dynamics CRM for Managing and Awarding Scholarships
A nonprofit organization whose primary focus is to advance quality care and education of children embarked on a transformative journey to use technology to improve organizational operations.
Miller Milling Revolutionizes Sales Operations with Streamlined Systems and Automated Processes
Recognizing the need to empower their sales team and enhance efficiency, Miller Milling embarked on a transformative journey with Microsoft Partner Stoneridge Software to overhaul their sales process.
Manufacturer of Compression Equipment Overcomes Manual Work Challenges, Enhances Productivity with Dynamics 365 Field Service
Stoneridge Software partnered with a leading provider of engine and compressor parts, field services, and shop repairs to face operational challenges in work order management, asset management, resource and scheduling management, time entries, and expense management.
Start the Conversation
It’s our mission to help clients win. We’d love to talk to you about the right business solutions to help you achieve your goals.


