


How to Create Up and Down Arrows in Power BI Reports
A frequent request for dashboards and reports is the ability to display an up or down arrow based on a threshold. It would be nice if the KPI Scorecard in Power BI gave us this capability out of the box. The KPI Scorecard is a great visual, however, if you want just an arrow to display a trend, there is nothing out-of-the-box to provide that in Power BI. I came up with a simple solution to this problem. Read on as I explain how to create up and down arrows in Power BI Reports.
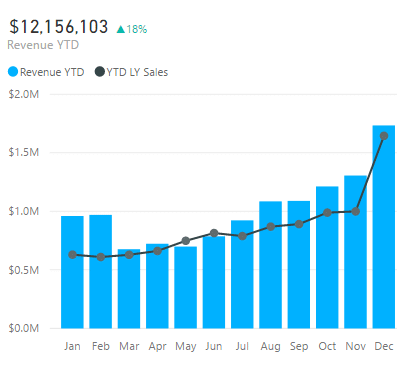
In this visual, you’ll notice that there is a green arrow pointing up. We’re going to recreate this arrow option in Power BI.
1) Create a new Column called “Arrows for Revenue Net Income” with the following logic. In my example, I’m taking the percent difference between this year vs. last year’s Revenue and determining whether or not it is on or off target. The SWITCH statement is similar to an IF statement but it is much cleaner to implement. You can create as many expressions within the SWITCH statement as required but I’ve only included two: one for an up arrow and one for a red down arrow.
Arrows for Revenue Net Income YTD = SWITCH(
                          TRUE(),

                   'Sales'[Net Income % Diff] <= 0, UNICHAR(128315),
                   'Sales'[Net Income % Diff] >= .010,UNICHAR(9650),
              BLANK()
             )
In order for us to get the arrows, we need to enter Unicode characters in the SWITCH statement. I wasn’t familiar with Unicode characters so I just went on Google to figure out which ones I needed.
2) Next, drag and drop the column onto the canvas and select the Table object in Power BI.
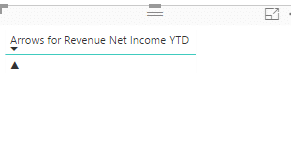
3) By default, the arrow is black rather than green as we required. There is no green up arrow in Unicode so we’ll need to change the font color of the arrow in Power BI to green.
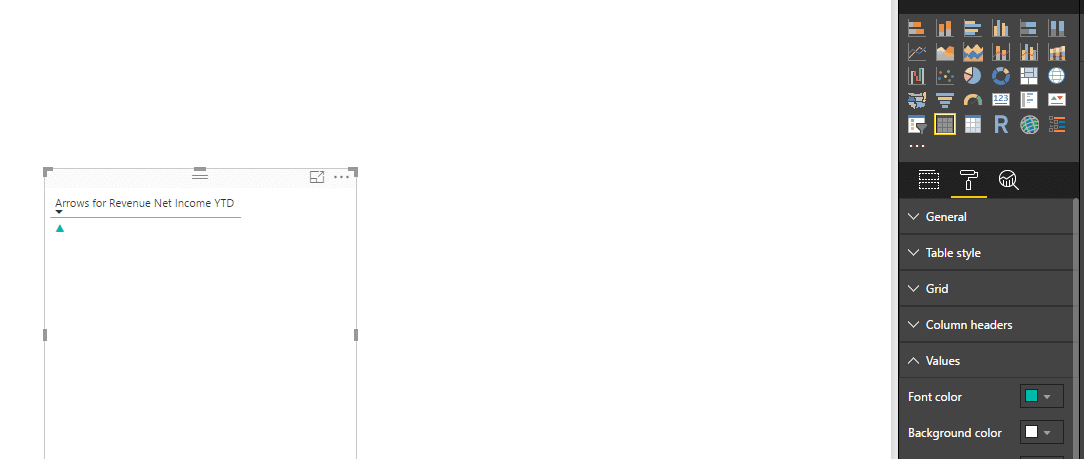
And that’s how easy it is to create trending arrows in Power BI!

Under the terms of this license, you are authorized to share and redistribute the content across various mediums, subject to adherence to the specified conditions: you must provide proper attribution to Stoneridge as the original creator in a manner that does not imply their endorsement of your use, the material is to be utilized solely for non-commercial purposes, and alterations, modifications, or derivative works based on the original material are strictly prohibited.
Responsibility rests with the licensee to ensure that their use of the material does not violate any other rights.