Creating Hierarchies in Power BI
One of the cool features in Power BI is that it allows you to create your own hierarchies. When a visual has a hierarchy, it enables the ability to drill down for additional relevant details. For example, you might have a visualization that shows the product hierarchy with revenue and you want to drill down on a specific product that is under-performing. By drilling down, you’re able to see the elements that make up the product and pin-point exactly what product or products are causing the decrease in revenue.
In this post we’ll cover how easy it is to create hierarchies in Power BI using the example above.
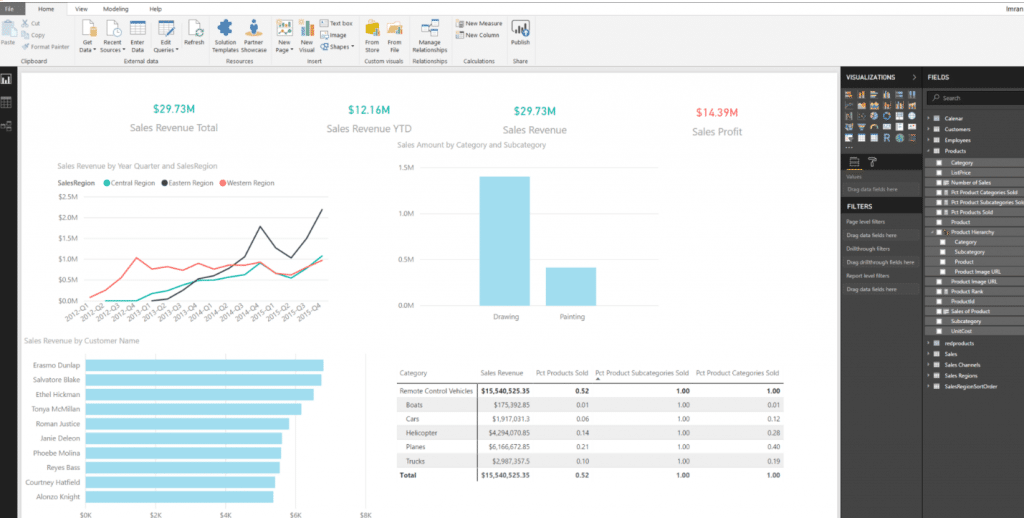
1) Before we build a hierarchy, we’ll need to know the levels that comprise the hierarchy. In our example, the levels are Category -> Subcategory -> Product -> Product Image URL.
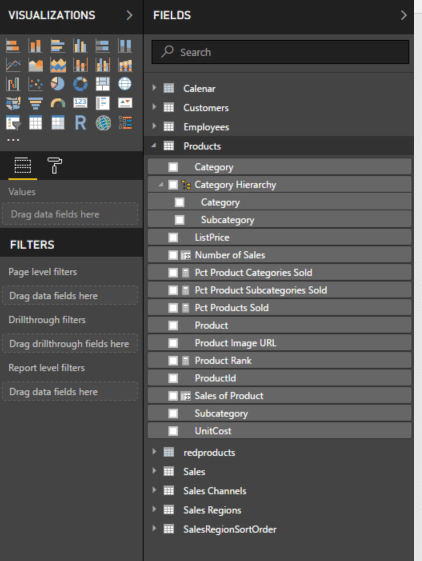
2) After we know the hierarchy levels, we’ll use simple drag/drop techniques to create the hierarchy. Since Category is our first level in the hierarchy, let’s look for Subcategory and place it right on top of Category. Notice that there is a new item was created called “Category Hierarchy.”
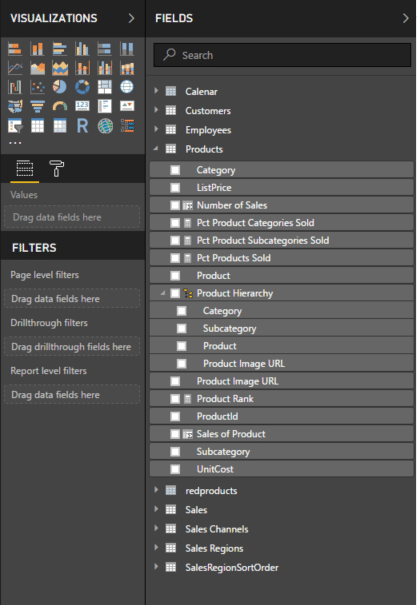
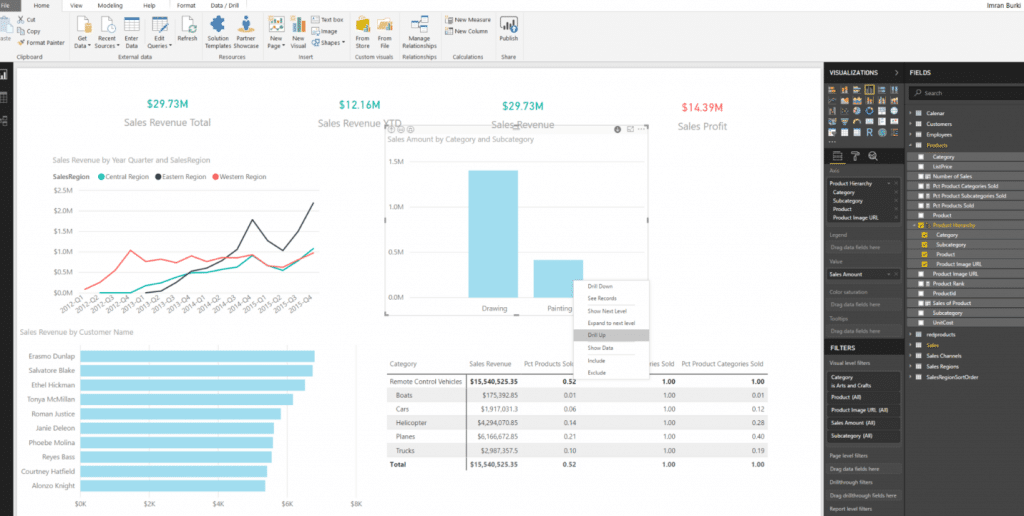
3) Finally, we’ll drag and drop Product, and Product Image URL on the Category Hierarchy we just created and rename Category Hierarchy to Product Hierarchy by right-clicking Category Hierarchy and selecting “Rename.”
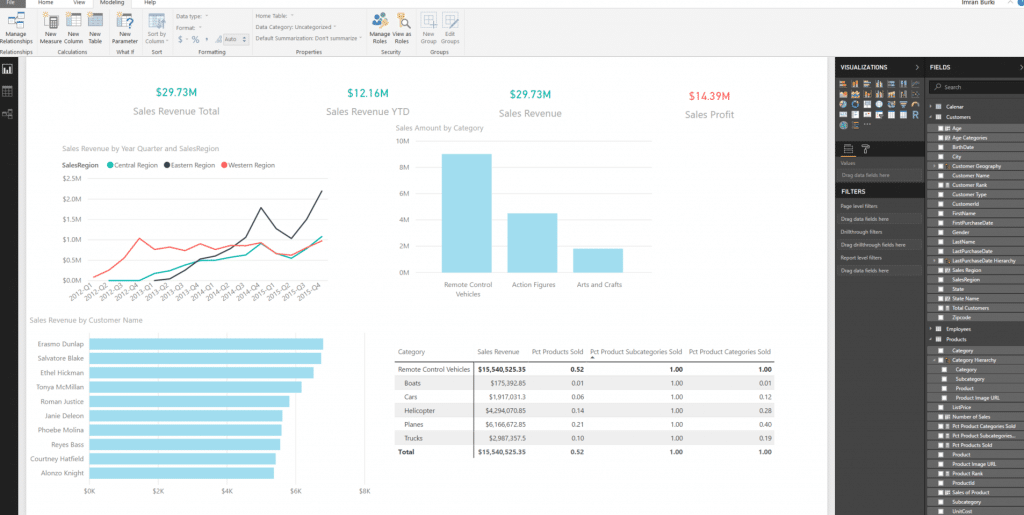
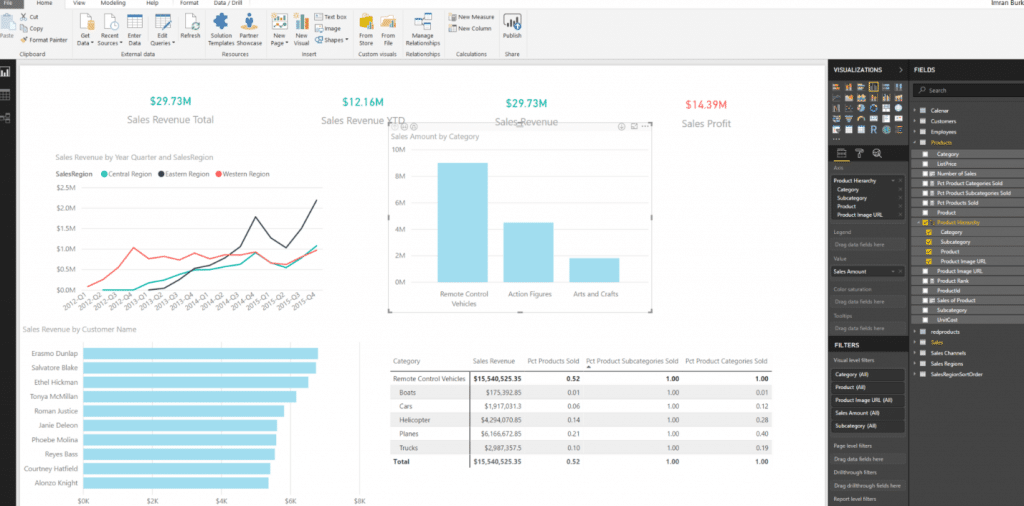
4) Now that our hierarchy is created, we can see it in action. In the top right-hand corner, we have a bar chart named “Sales Amount by Category” where the drill actions will take place. There are two methods to drill up/down. First, you can right-click on a bar and drill down or you can turn drill down on. By turning drill down on, we’ll be able to drill down on a level by clicking on it rather than doing a right click. My personal preference is to turn drill down on.
5) To turn drill-down on, click on the chart and click on the down arrow in the top right-hand corner of the chart. Once enabled, the down arrow will have a black background.
6) We see that “Arts and Crafts is our lowest performer in terms of sales. To drill down on that item, simply click on it and the chart will immediately go to the next level.
7) To drill back up you can right-click any bar and select “Drill Up” and the report will go back up one level.
Drilling up/down allows us to slice and dice our data to uncover patterns and anomalies. In this short demonstration, we saw how easy it is to create a hierarchy in Power BI and enable drill up/down functionality.
Under the terms of this license, you are authorized to share and redistribute the content across various mediums, subject to adherence to the specified conditions: you must provide proper attribution to Stoneridge as the original creator in a manner that does not imply their endorsement of your use, the material is to be utilized solely for non-commercial purposes, and alterations, modifications, or derivative works based on the original material are strictly prohibited.
Responsibility rests with the licensee to ensure that their use of the material does not violate any other rights.


