


Dynamics NAV Analysis Views With Excel Pivot Table
There is a Cherokee proverb, “Do not allow yesterday to use up too much of today.” Applied to our data, this would implore us to find tools that allow us to analyze historical data quickly so we can spend the bulk of our time and resources making smart decisions about our business going forward.
One of the most powerful tools in Dynamics NAV, allowing us to see deeply into our business, is the Financial Dimension. If you are not using dimensions already, you should absolutely start. For a longer tutorial on this instrument, please see part 2 in my past series for Dimensions in NAV2013 – which is still very relevant today: /dimensions-in-nav2013-part-2-deployment/
Once you have dimensions in place and have generated some history, the best tool for analyzing that data is an Analysis View – and specifically, an Analysis View sent to Excel as a PivotTable. If you are only using one or two dimensions, you can get most of what you need from the ledger entries themselves. If you have more than two dimensions, or have only one or two and wish to quickly review results or get the data to Excel, the Analysis View is very powerful.
An Analysis View simply provides a better way to view your general ledger data, including dimensions applied to those entries. Setting up an Analysis View is straight-forward: https://msdn.microsoft.com/en-us/library/hh169217(v=nav.90).aspx. The only limitation is that any single analysis view you create is limited to four dimensions. Because of this, clients often choose to create multiple Analysis Views for different purposes.
Once an Analysis View has been created and updated, getting the data to a PivotTable in Excel is relatively easy.
1. Go to Analysis by Dimensions in NAV
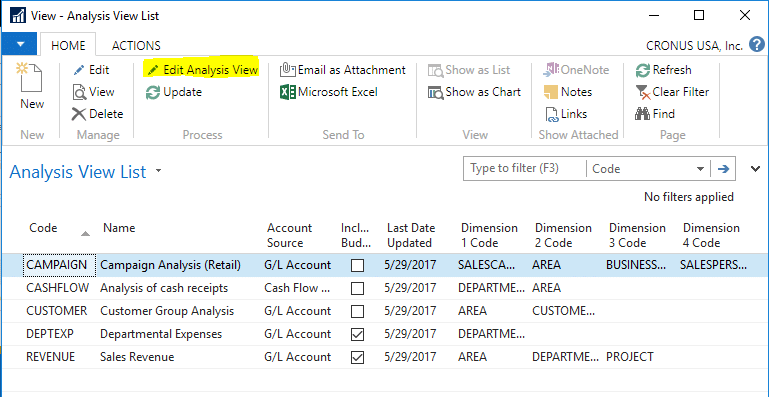
2. Select “Edit Analysis View” from the ribbon (not “Edit”)
3. Apply any additional filters you might want to be applied to the data. This can sometimes be helpful to avoid row limits in Excel. Take time to note the additional options on the page as well.
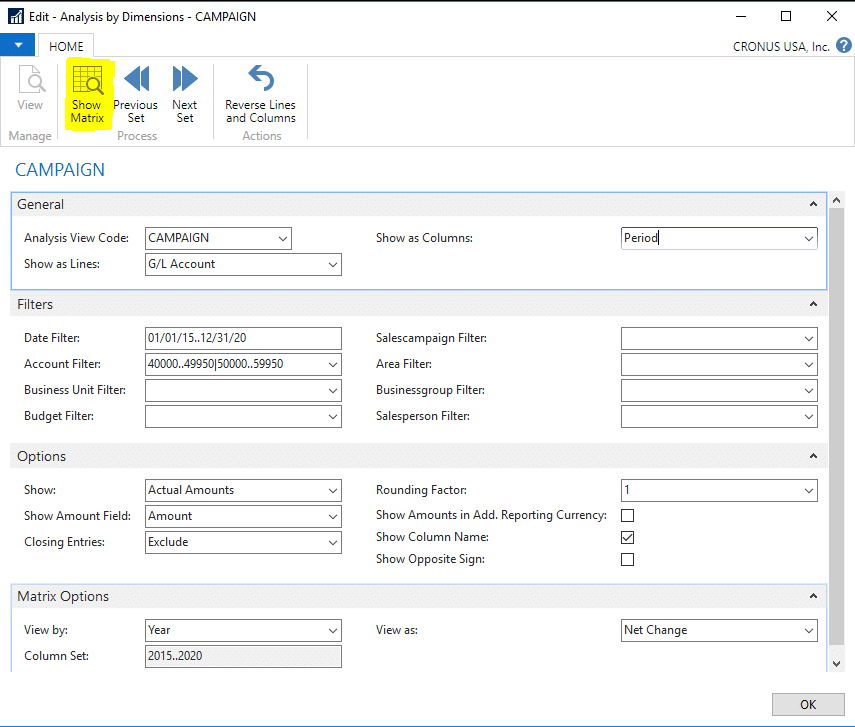
4. Select the “Show Matrix” ribbon option
5. Select the Export to Excel ribbon option
6. Use the PivotTable Fields area on the right to add filters and change rows and/or columns
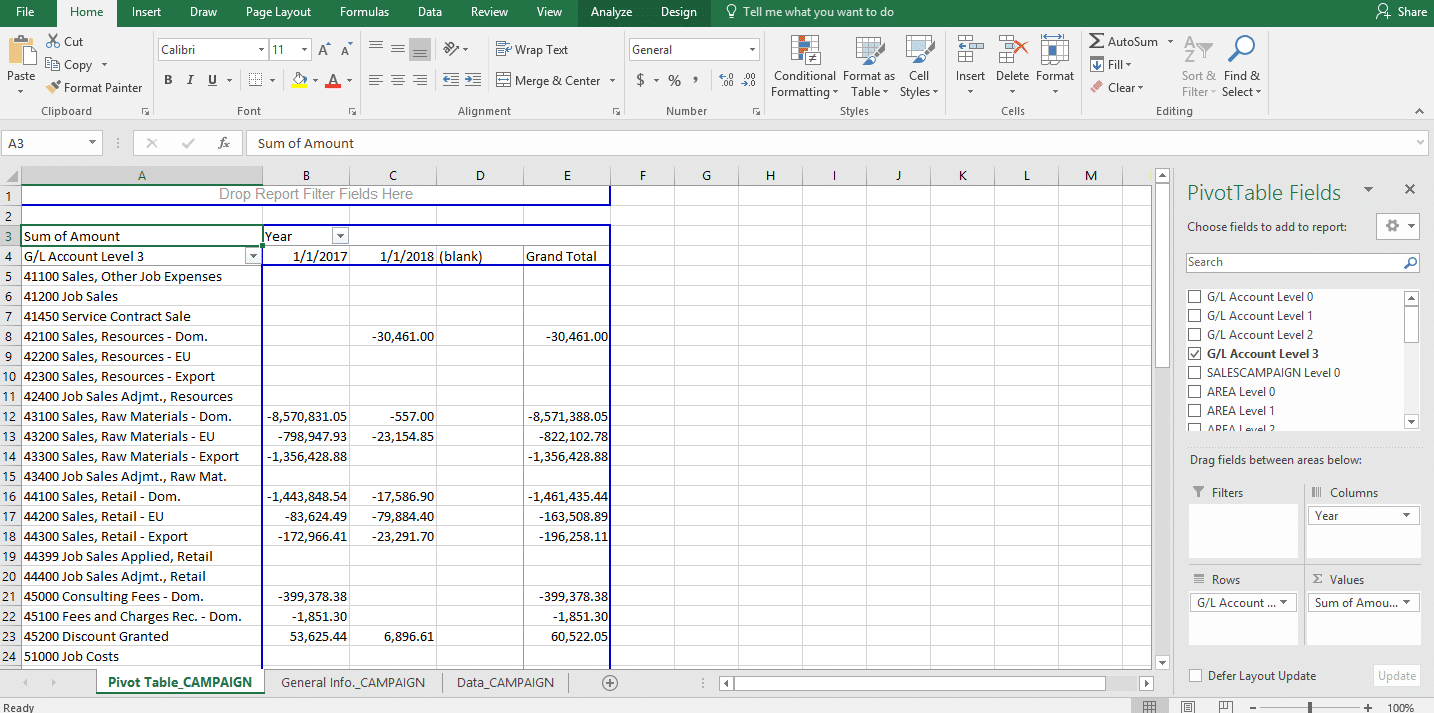
The Excel Pivot Table, combined with your financial data in NAV, should provide you deep insight into trends within all areas of your business – allowing you to invest less time in the business of yesterday and more time in the business of today and forward.

Under the terms of this license, you are authorized to share and redistribute the content across various mediums, subject to adherence to the specified conditions: you must provide proper attribution to Stoneridge as the original creator in a manner that does not imply their endorsement of your use, the material is to be utilized solely for non-commercial purposes, and alterations, modifications, or derivative works based on the original material are strictly prohibited.
Responsibility rests with the licensee to ensure that their use of the material does not violate any other rights.