


How to Connect Your Dynamics GP Data to Power BI
Connecting your Dynamics GP Data to Power BI can help you bridge the gap between data collection and utilization.
Many companies understand how to collect and compile the various datasets that can be manually turned into visualizations and reports. However, understanding how to take the data in your Dynamics GP environment and combine it with the many capabilities of Power BI will allow you to take your data utilization to new heights.
In this blog, we’ll dive into the background of Power BI and go through an example of how you can easily use your GP Data to create an actionable and interactive sales report in Power BI.
What is Power BI?
Power BI is a cloud-based interactive data visualization tool that spans a lot of Microsoft technologies, including Office 365, Azure, Dynamics 365, and other standalone applications. It is low code and can be connected to over 100 sources.
Another perk is that it’s easy to use. While there is still a learning curve, general users don’t have to be coding experts to use it.
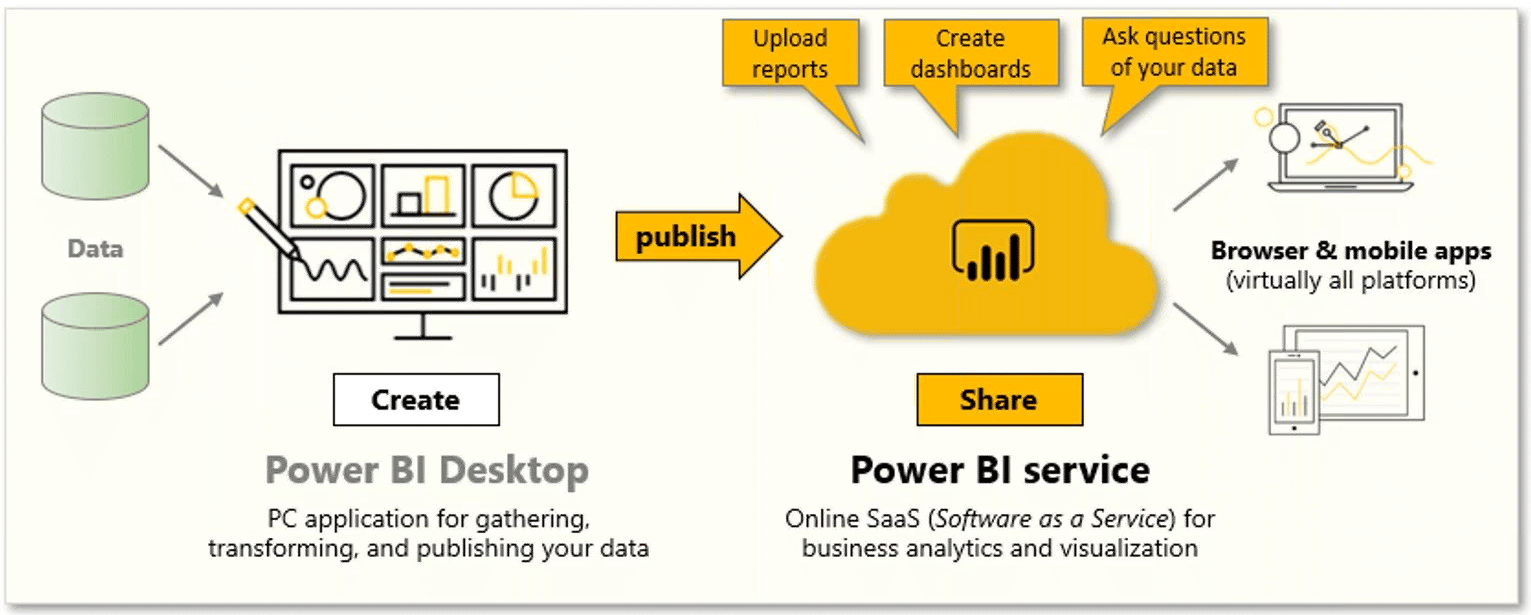
There are two components to the Power BI Workflow:
- Power BI Desktop – This is where you bring in your data and create visuals
- Power BI Service – This is where you publish and share your data after you create it
Power BI Desktop is free for anyone to download and use. Power BI Service requires both the visual creator and the person they are sharing it with to have licenses, which are issued on a per-user basis.
You can find more about Power BI pricing here.
How to Create a Power BI Visual with Dynamics GP Data
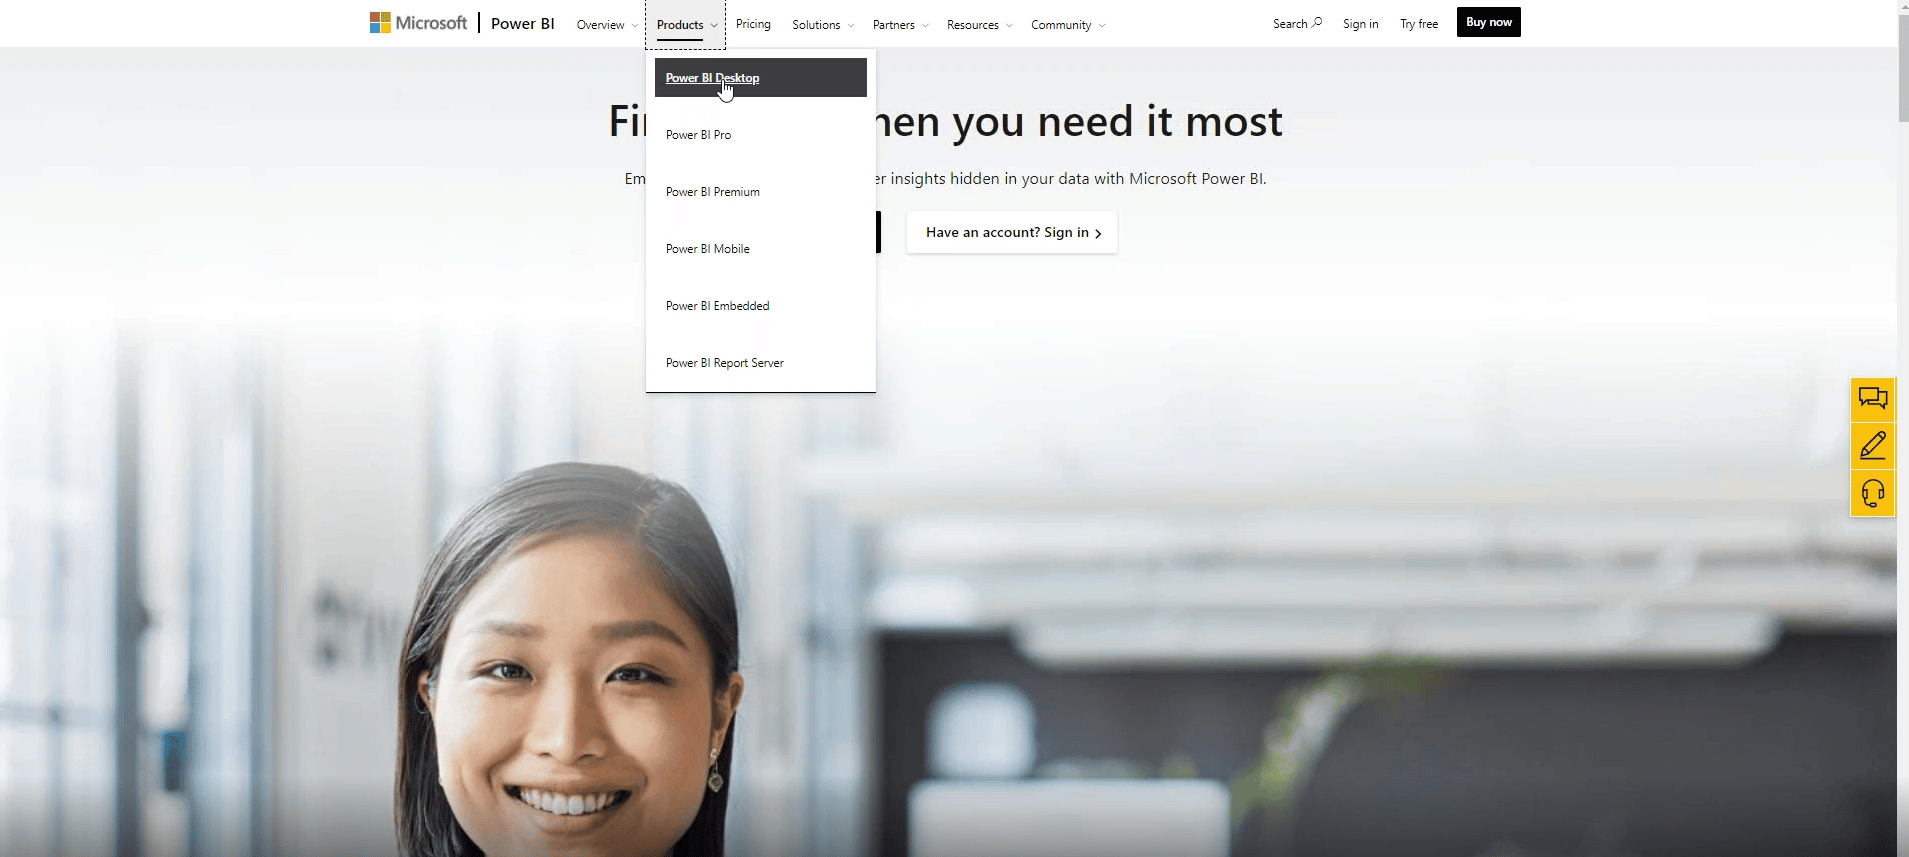
If you already have Power BI Desktop, you can get started right away! If not, go to powerbi.microsoft.com, navigate to Products –> Power BI Desktop –> and download it for free.
For the purposes of this blog, we are going to create a Sales Dashboard and follow these steps:
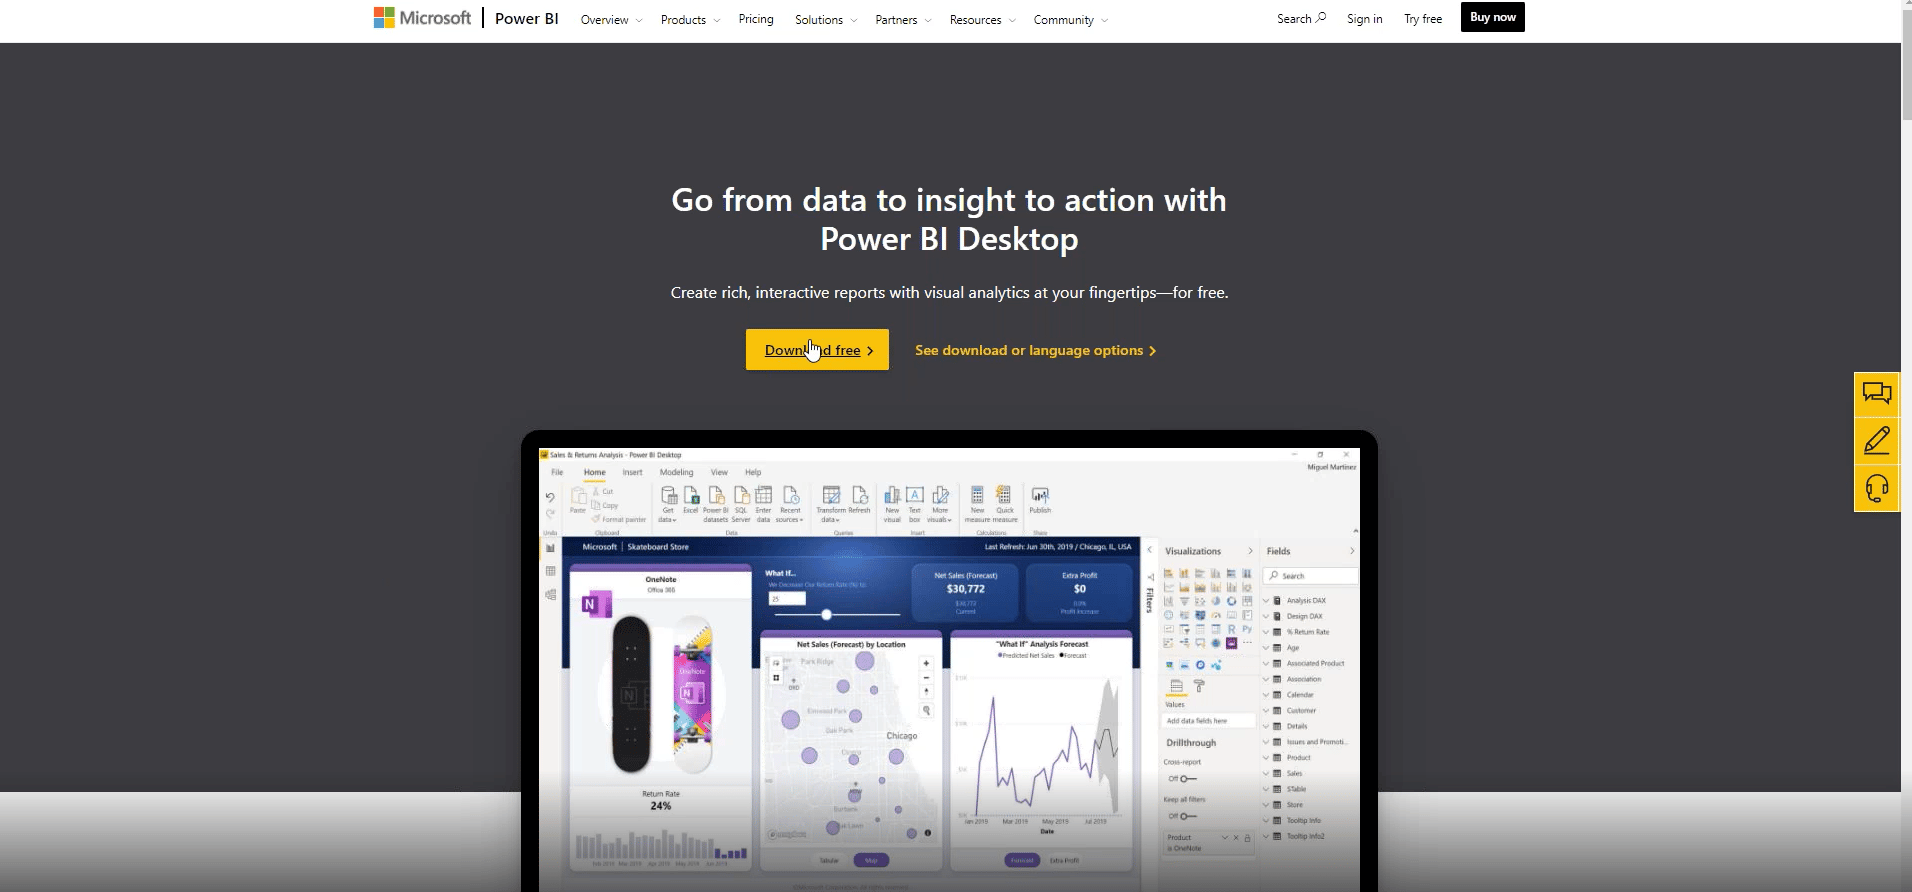
1 – Once you are in your Power BI area, click on “Get Data” and then select your data connector
In this instance, we will select Dynamics GP. Note: If you don’t see the connector you need, click on “More” to view a bigger list.
2 – Search for the Server Name of your GP environment in the SQL Server database
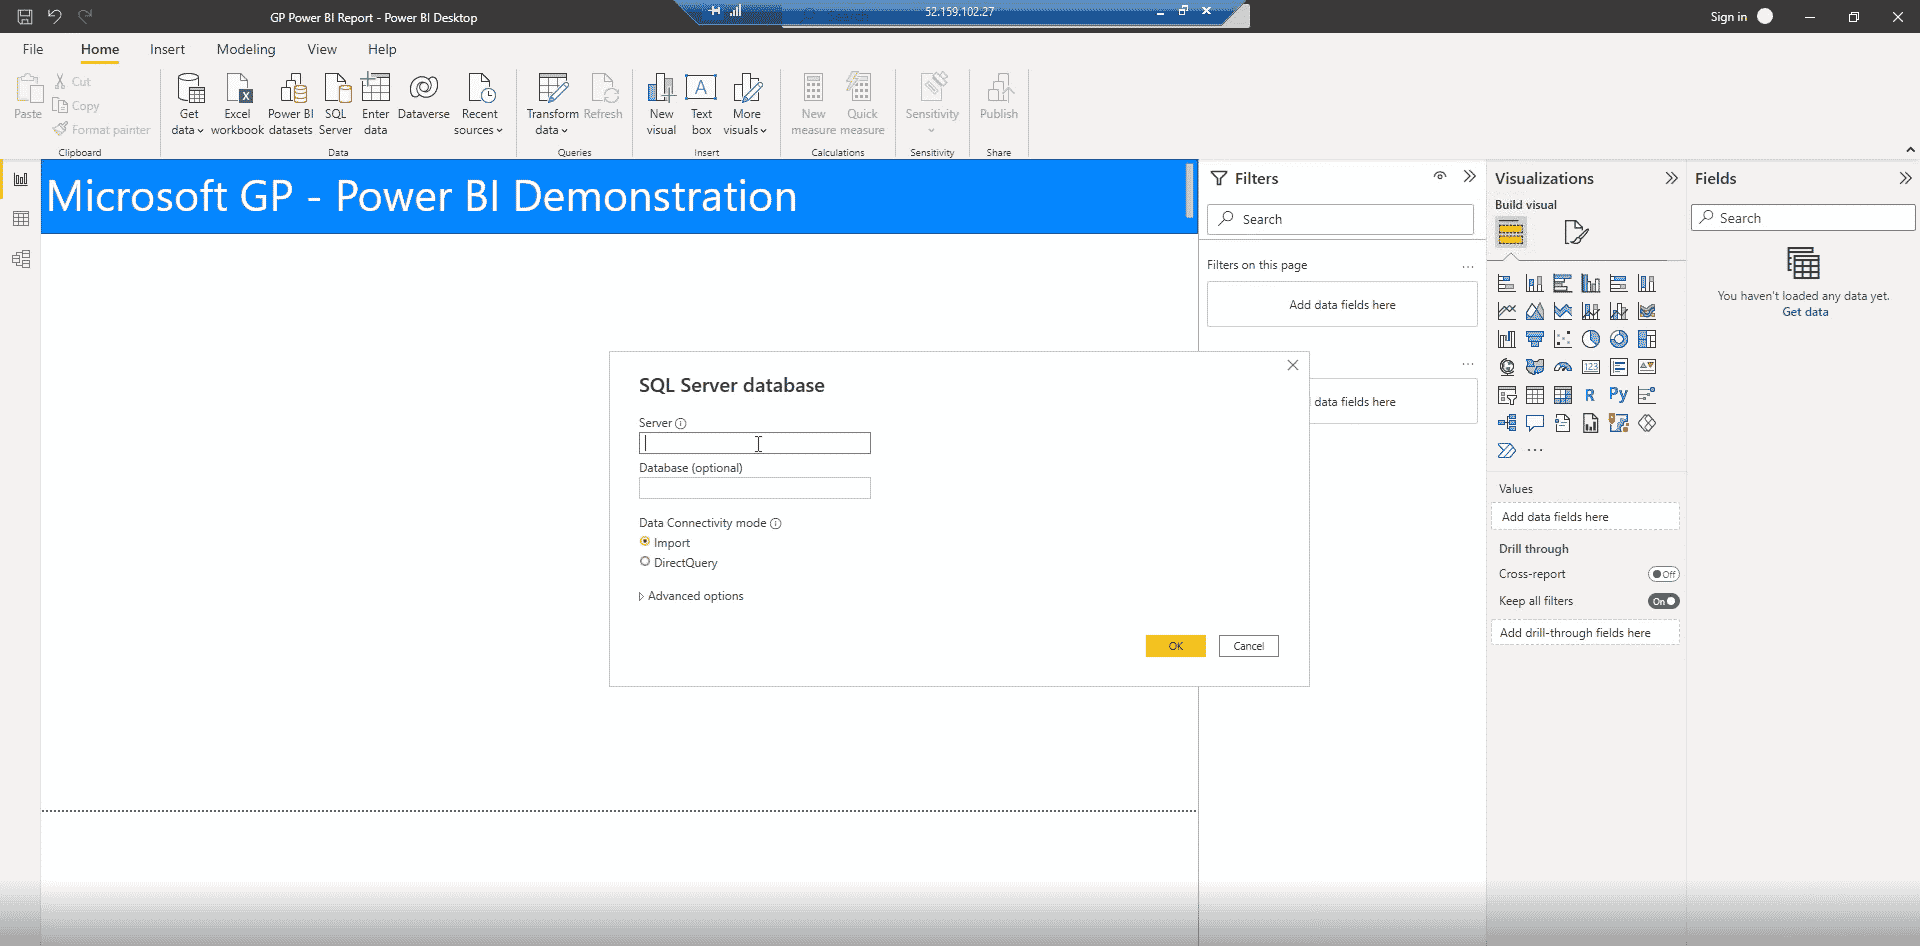
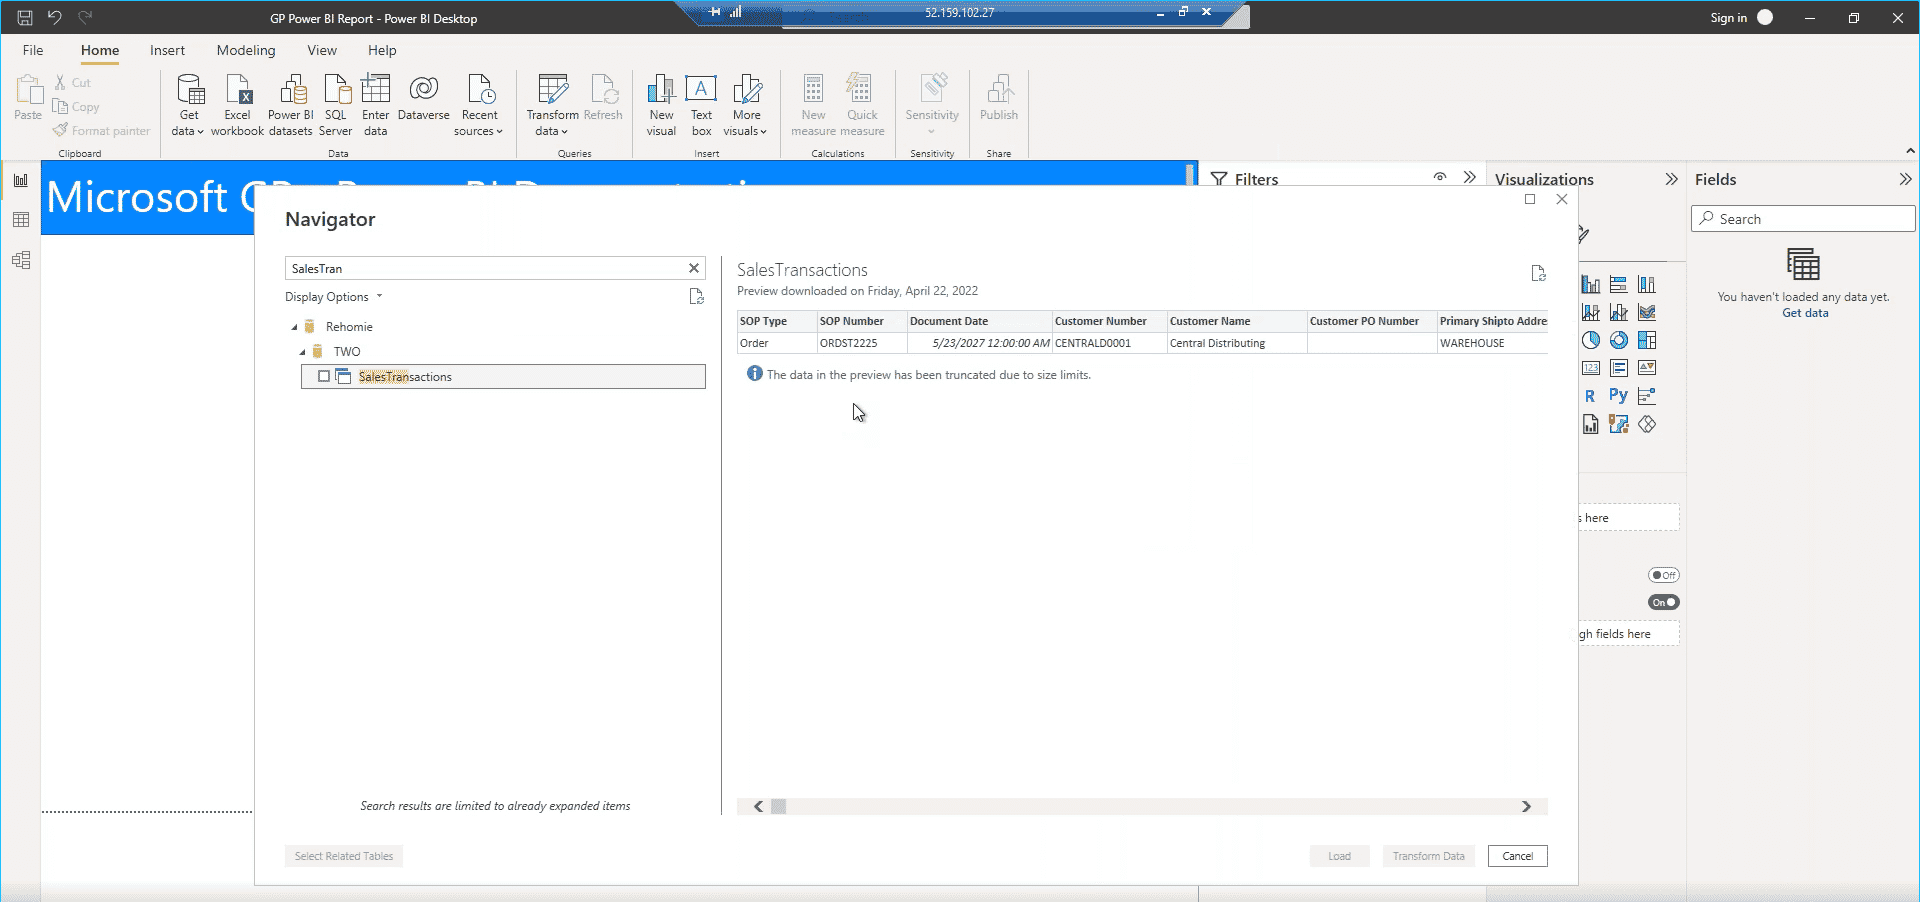
3 – Select the table or dataset you want to turn into a Power BI visual
They are typically coded. If you don’t know what those codes mean you can find more information here. For this example, we are going to select the view SalesTransactions. To make things easier, you can also search for your view if you know the name. You can also preview the data in the view to make sure it is all there.
4 – Load your view or table into Power BI and then you will find the table on the right-hand side of your screen under the Fields heading
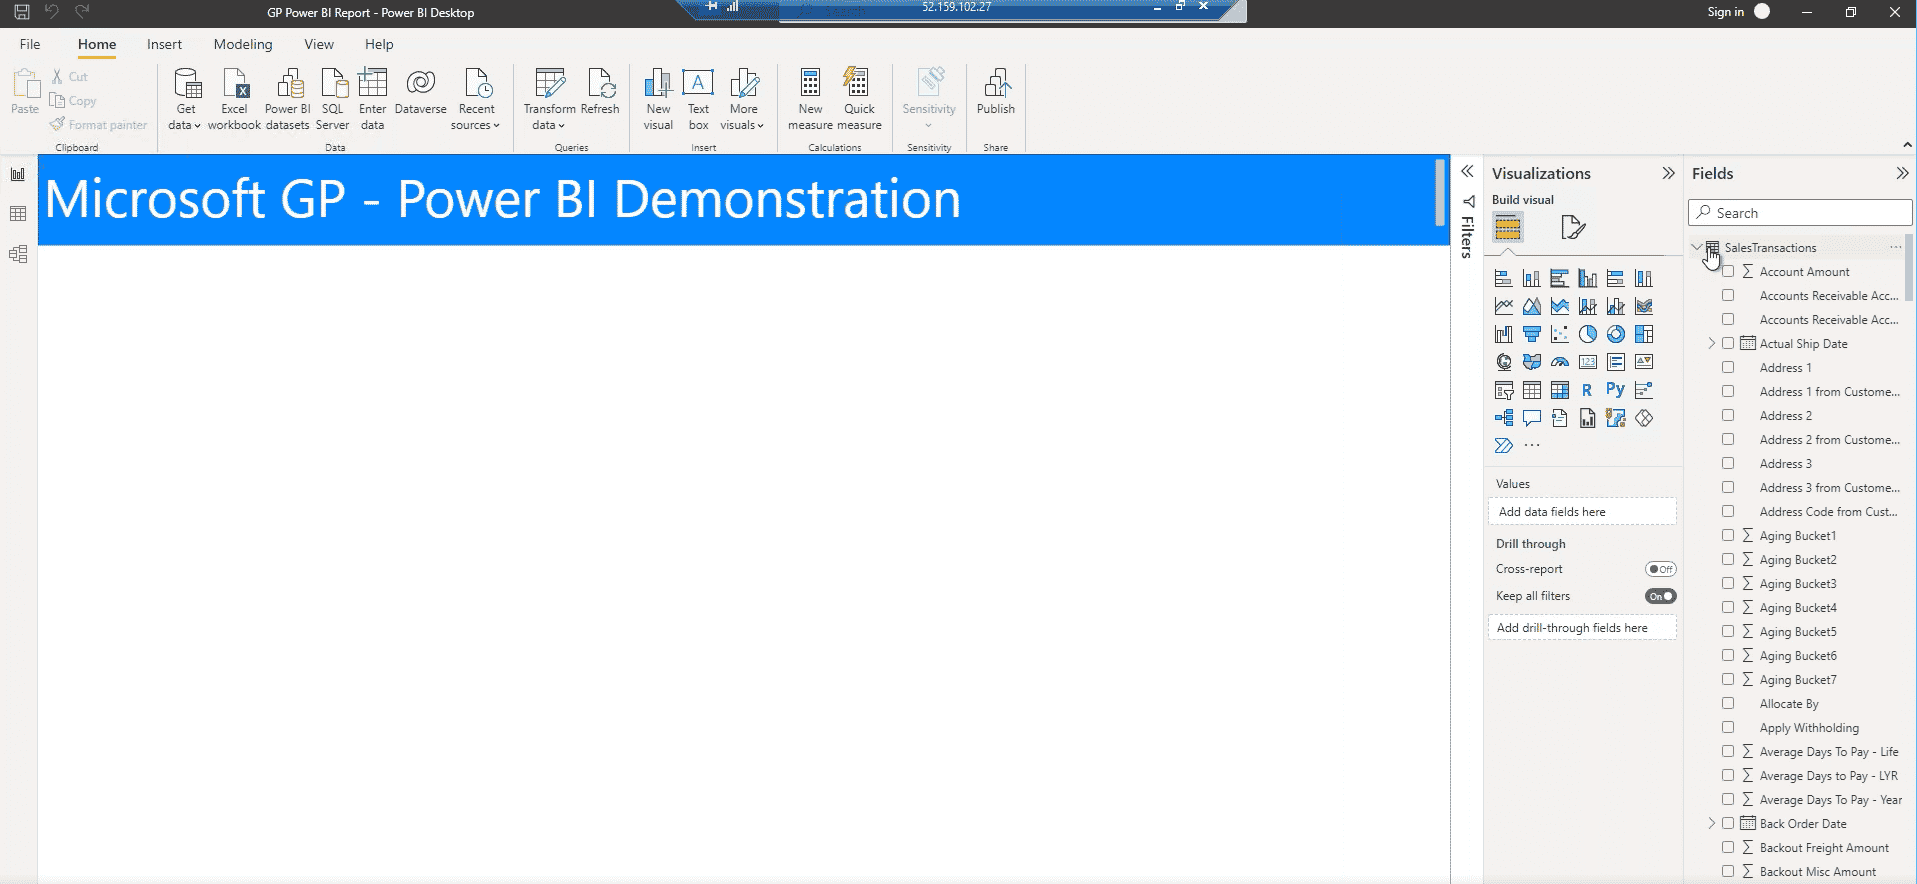
In this example, the SalesTransactions view contains a lot of data. If you hit the drop-down menu you can view the individual datasets within it to find the one you need.
You can also view the full table by clicking on the table icon on the left-hand side.
![]()
5 – Select one of the various visuals from the right-hand side of your screen, create your report, and set its parameters and filters
In this stage, you can select the style you want to display your data in, set your axis, and filter your data so it makes sense for this report. In this example, I am creating a line chart showing sales by month. I have set my Y-axis as Document Amount and the X-axis as Document Date. Then I will filter it so it shows me daily sales.
6 – Add other visualizations based on what you want to show in your report
In this example, in addition to the line chart, we will list our top-5 customers during the date range detailed in the dataset. You can also change the titles of each visual, add cards that can display numbers relevant to the report, and slicers that allow people to filter by date and customer.
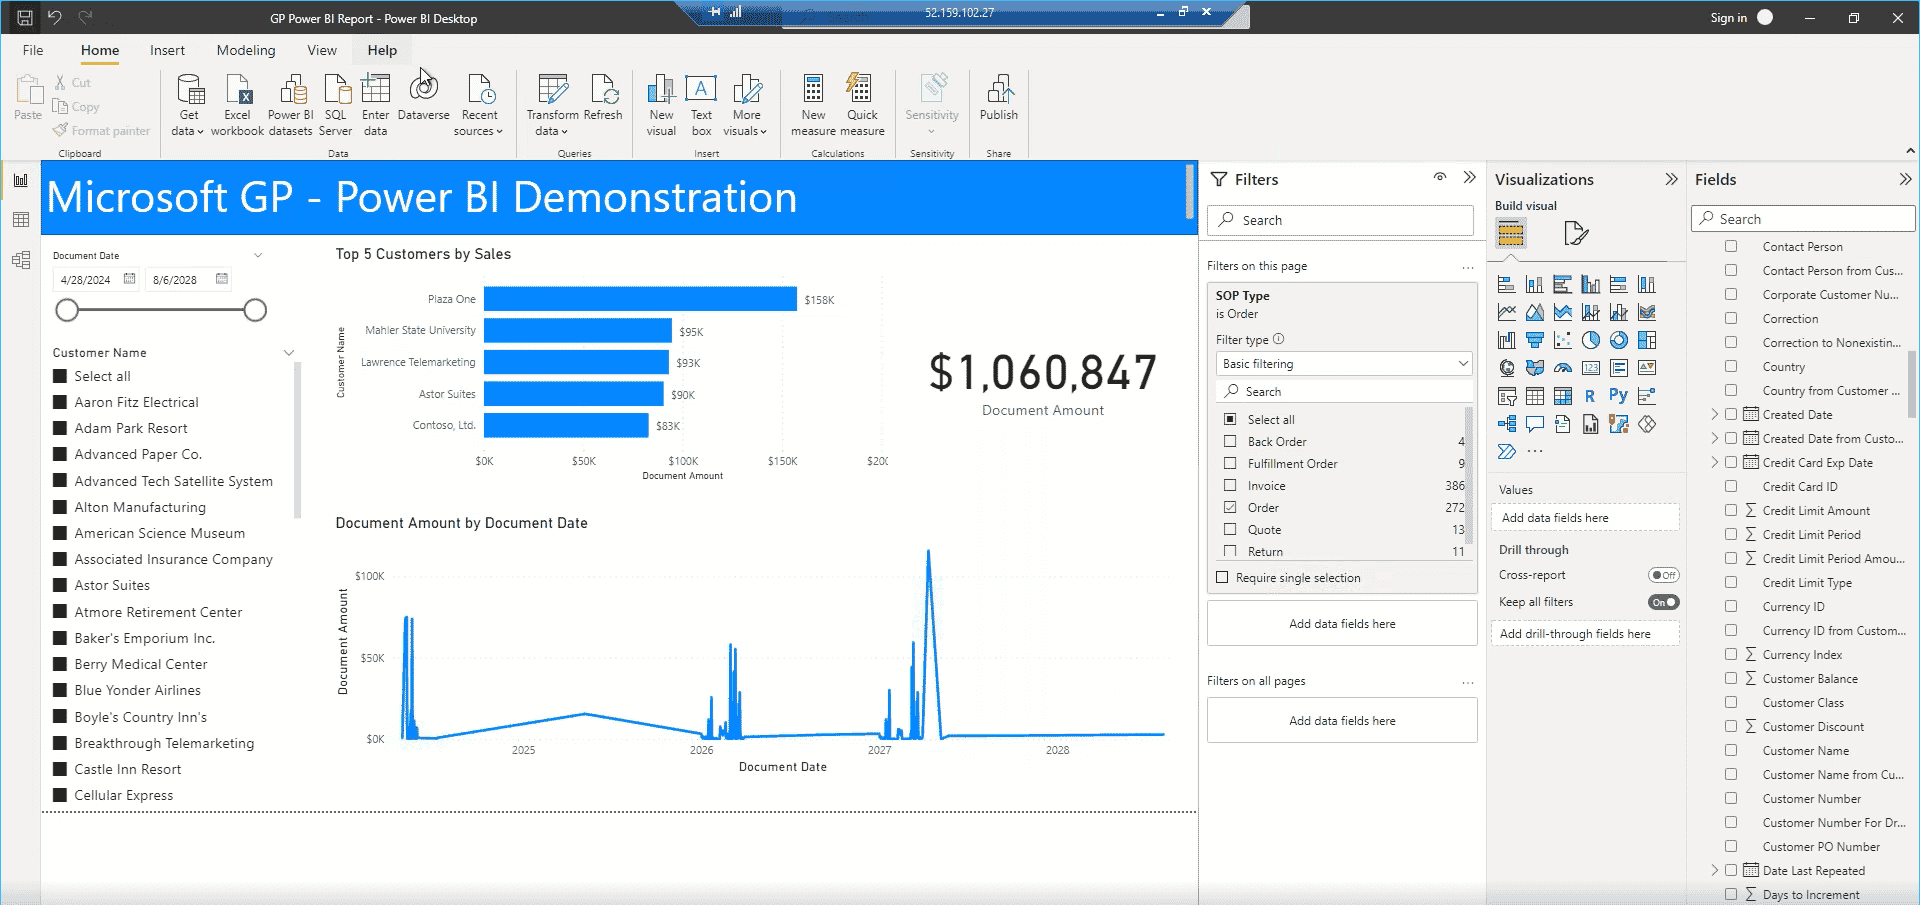
In the finished example above, you can see all the different features I added to this Sales Dashboard.
7 – Save your and publish your dashboard
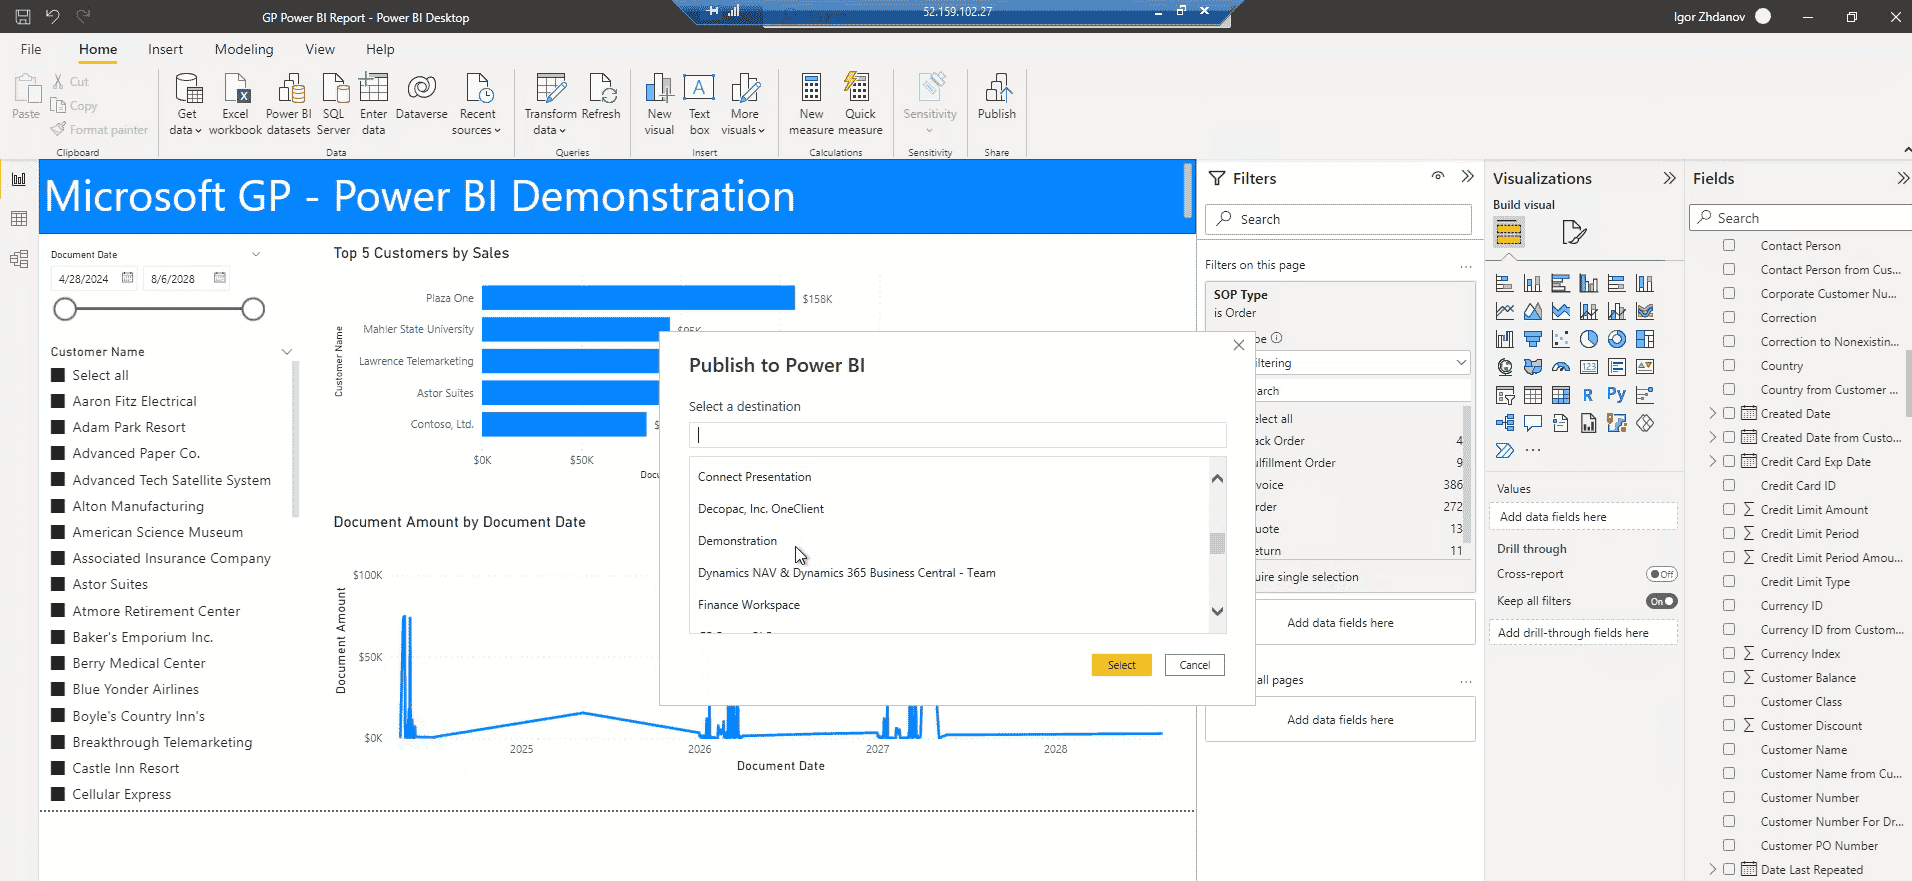
You can publish it directly to your Dynamics GP workspace. It will ask for your Microsoft login, password, and authentication. This is where Power BI Service takes over.
8 – Switch over to Power BI Service by visiting app.powerbi.com
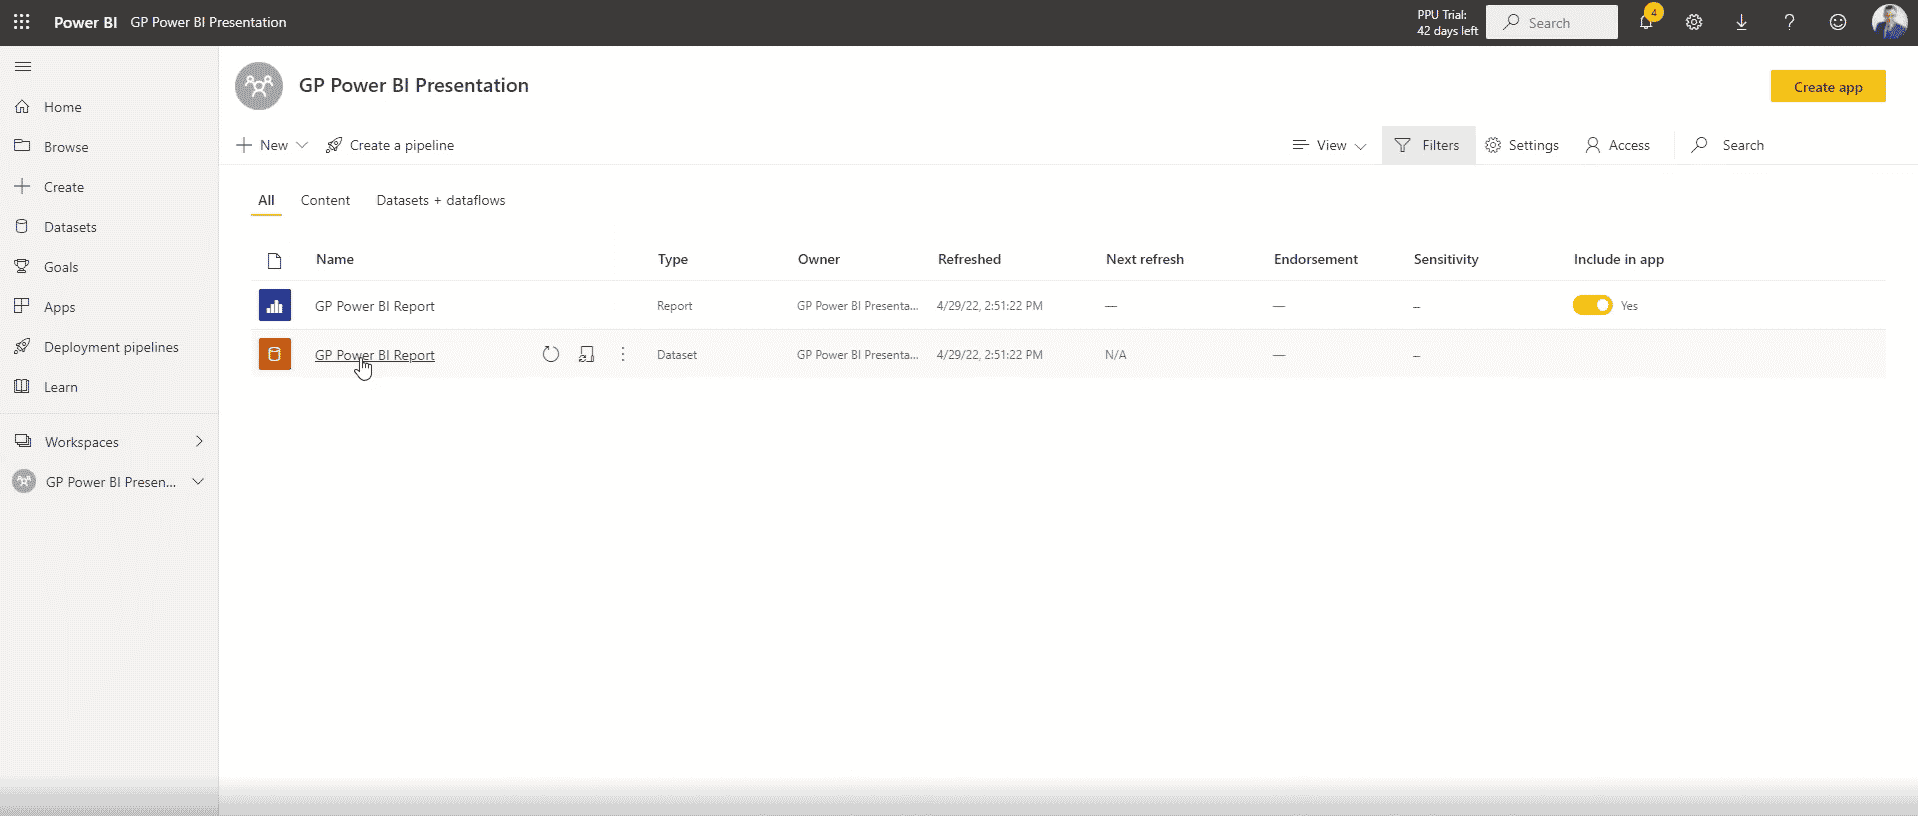
Navigate to Workspaces on the left-hand side and find your GP Workspace. From there you should see your report and you can start viewing and sharing it.
You can also schedule your report to refresh the data contained in it automatically up to eight times a day.
Why Use Power BI to Display Your Data?
This is just a snippet of one of the many great features Power BI, and the Power Platform at large, have that can help your business. It also integrates seamlessly with many other Microsoft tools such as Teams. You can view your Power BI reports that contain almost real-time insights during meetings.
For example, if a member of your sales staff is pitching to a prospective client on Teams, they can display this Sales Dashboard in their Teams environment and have access to almost real-time data that can help them during that pitch.
Power BI has something for everyone!
Questions?
Contact us if you want to learn more about how to get the most out of your data using Power BI.

Under the terms of this license, you are authorized to share and redistribute the content across various mediums, subject to adherence to the specified conditions: you must provide proper attribution to Stoneridge as the original creator in a manner that does not imply their endorsement of your use, the material is to be utilized solely for non-commercial purposes, and alterations, modifications, or derivative works based on the original material are strictly prohibited.
Responsibility rests with the licensee to ensure that their use of the material does not violate any other rights.