Leveraging Power BI for Business Central – Part 2: Get the Data You Want
In Part 1 of this series, I showed you how to connect Power BI to your Business Central environment. In this post, I will walk through how to enable you to work with the data you want while also doing some basic data organization.
Web Services
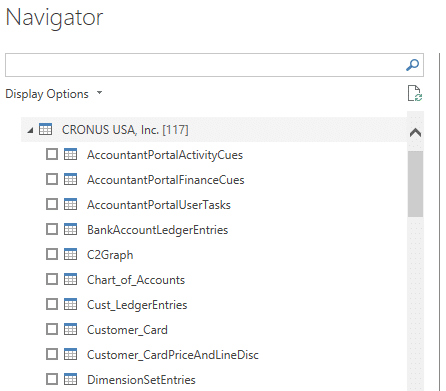
In the last post I showed a list of tables you can load into Power BI that looked like this:
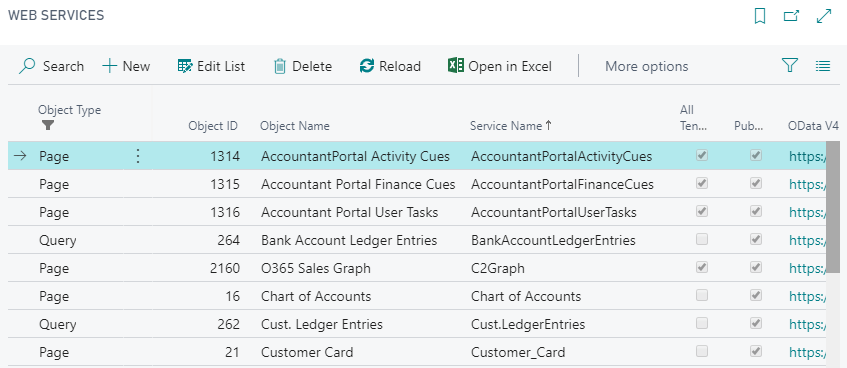
These available tables are found as “Query” or “Page” records in your BC environment on the “Web Services” page:
Each company has its own list of web services, so if you make changes to this list for one company, it will not be reflected in another.
Pages
Page records contain data found in tables used to populate BC pages. Most Pages map 1-to-1 to the tables they pull from, but I have come across a few instances where using the page does not contain all of the fields that the actual table contains. When you need to pull in a field from a table that is not found in the page record, you’ll need to create a Query which requires making an extension. I may show how this can be done in a future post.
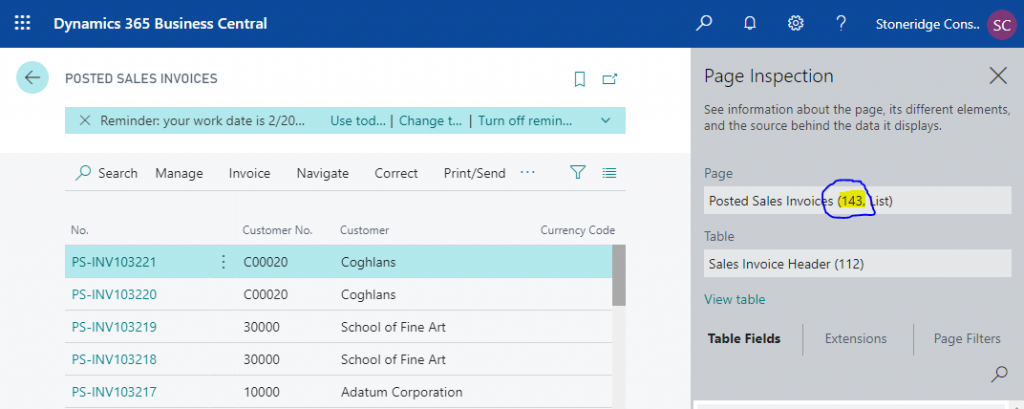
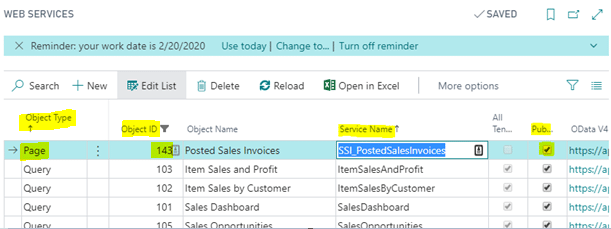
For now, if the data you need is not found in this list, go to the page in Business Central on which you see the data, execute Ctrl + Alt + F1 to open page inspection, copy the Page ID number, and add it to the Web Services list:
Be sure to give your new Web Service a type of Page, a Service Name (no spaces allowed), and to check the box to publish the web service.
This Web Service is now ready for use within Power BI the next time you wish to add data.
Queries
Queries are constructed from tables found in the database. The current list of queries found in Web Services are ones that Microsoft provides by default. You may first want to check if any of the existing queries contain the data you need before adding a new Page. They may have intuitive lookups to other tables (e.g. reading from the Customer Ledger Entry table and including additional information about the Customer from the Customer master table), or they may have stripped away additional columns you don’t need which allows for faster data refreshes.
Table linking
Once you load multiple tables into Power BI, both of those tables are ready for use. However, suppose you wish to link two tables together such that you can display data from one table while including additional information from another that is related to that record.
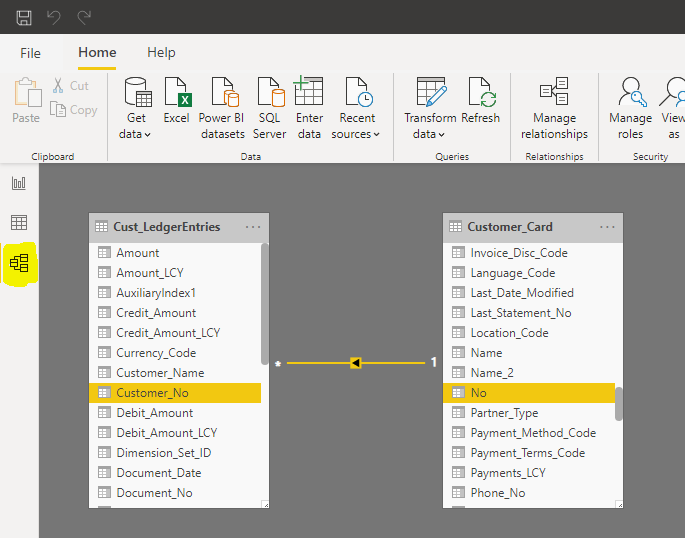
For instance, suppose you wish to see sales numbers broken down by State. The sales information is found on the customer ledger entry table/page. However, there is no State information found on this table. We’ll need to link the Sell-to customer to the Customer No. in the Customer table to find out which state each sale can be assigned to. To do that, we’ll load both the customer ledger entry information as well as the master customer information.
Once they are in, we go to the Model tab and select the fields that are related between the two tables by clicking and dragging between the two fields.
Now, when we create a report of this data, it will automatically know to link these tables and allow for us to display the correct information from each table.
In the next post, I will show how to create new columns and modify the data as needed.
Under the terms of this license, you are authorized to share and redistribute the content across various mediums, subject to adherence to the specified conditions: you must provide proper attribution to Stoneridge as the original creator in a manner that does not imply their endorsement of your use, the material is to be utilized solely for non-commercial purposes, and alterations, modifications, or derivative works based on the original material are strictly prohibited.
Responsibility rests with the licensee to ensure that their use of the material does not violate any other rights.


