


How to Use Time Intelligence in Power BI Using DAX
In my last blog, I introduced DAX and we created a column and measure. In this blog post, we’ll go over how to use time intelligence in Power BI using DAX. Time intelligence functions enable you to manipulate data using time periods such as years, quarters, months, and days and creating calculations over those time periods. The most common time periods that we encounter in business scenarios are usually Year-to-Date, Quarter-to-Date, Month-to-Date, Last Year Full Year, and Rolling 12 Months. There are many other time intelligence functions in DAX. You can find the entire list of time intelligence functions here.
To use time functions in Power BI, you need to have a table that contains at least one column that has a data type of Date. This column should have only one row per day for all the range of dates with no gaps. In our example, we have a “Calendar” dimension that contains a column called “Date” that is a type of Date column.
Now that we have our requirements for using Time Intelligence functions in Power BI let’s start creating some. We’ll create these calculations in our Sales table.
Year-to-Date Revenue
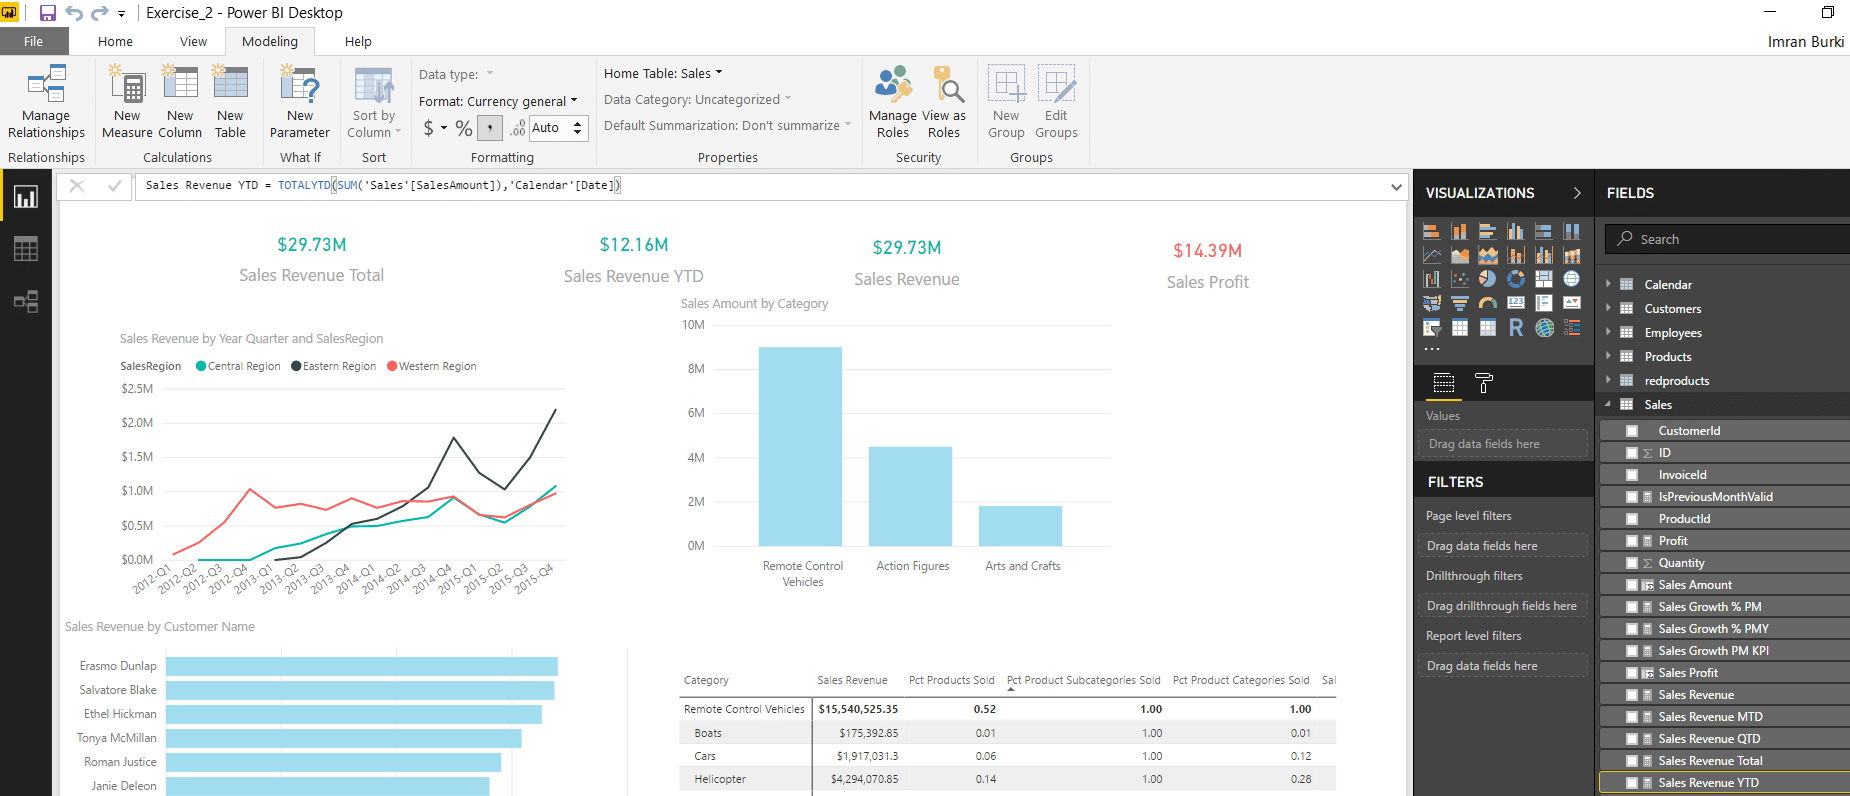
Enter this in the text bar: Sales Revenue YTD = TOTALYTD(SUM('Sales'[SalesAmount]),'Calendar'[Date])
The syntax is TOTALYTD(<expression>,<dates>[,<filter>][,<year_end_date>]).
The TOTALYTD function returns the year-to-date based on the latest date in our calendar dimension or a year_end_date that we specified. SUM function will add all the number sin the SalesAmount column.
Quarter-to-Date Revenue
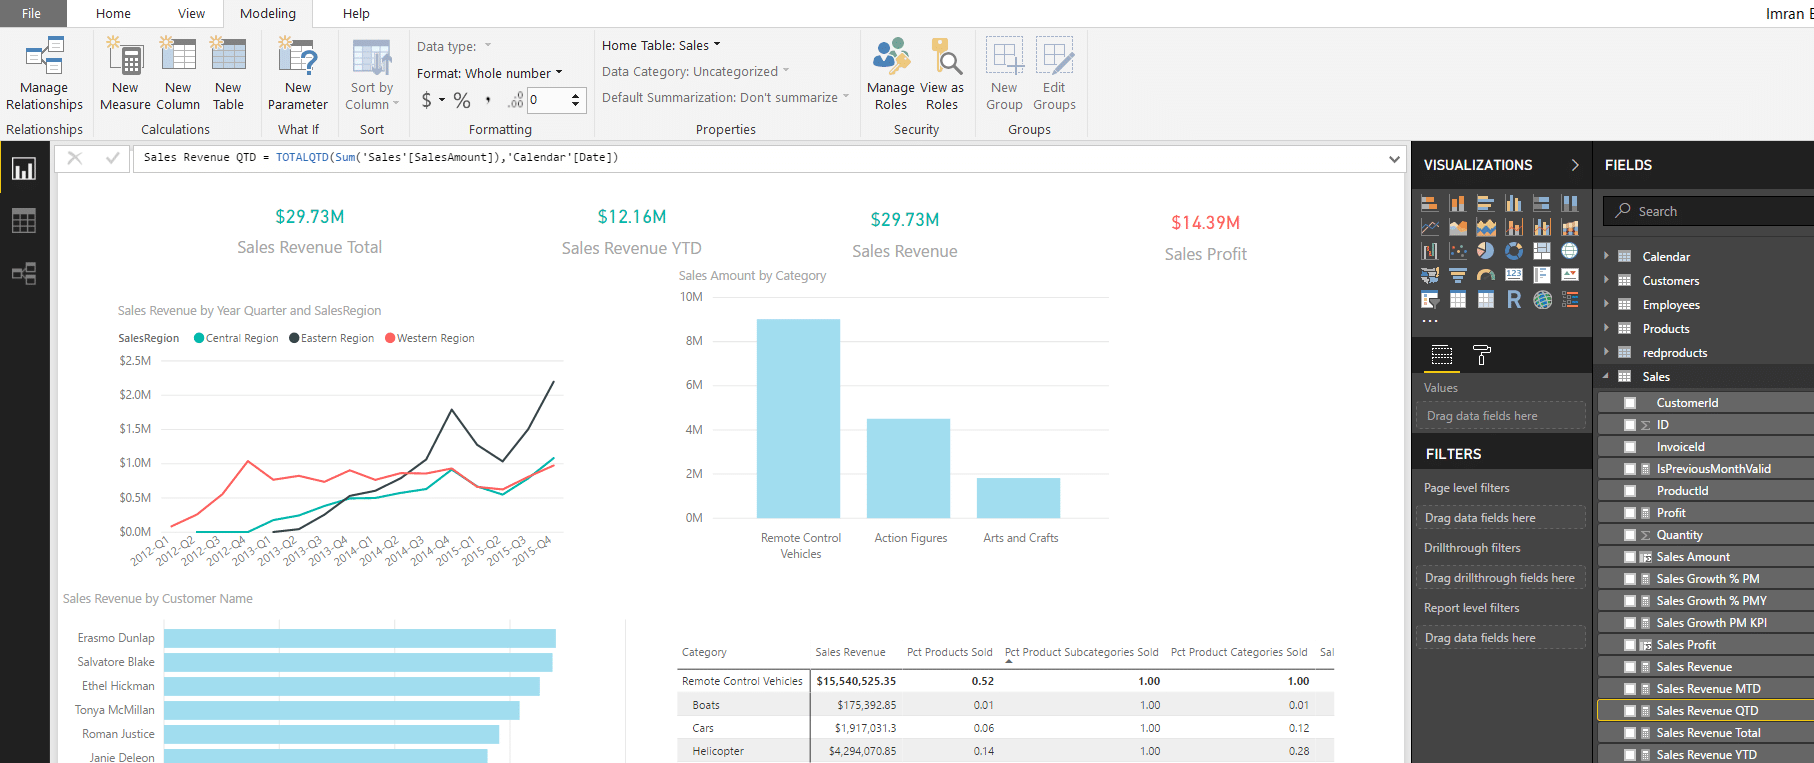
Enter this in the text bar: Sales Revenue QTD = TOTALQTD(SUM('Sales'[SalesAmount]),'Calendar'[Date])
The syntax is TOTALQTD(<expression>,<dates>[,<filter>]).
The TOTALQTD function returns the quarter-to-date based by evaluating al dates in the current quarter to date. The filter is optional to apply to the current context.
Month-to-Date Revenue
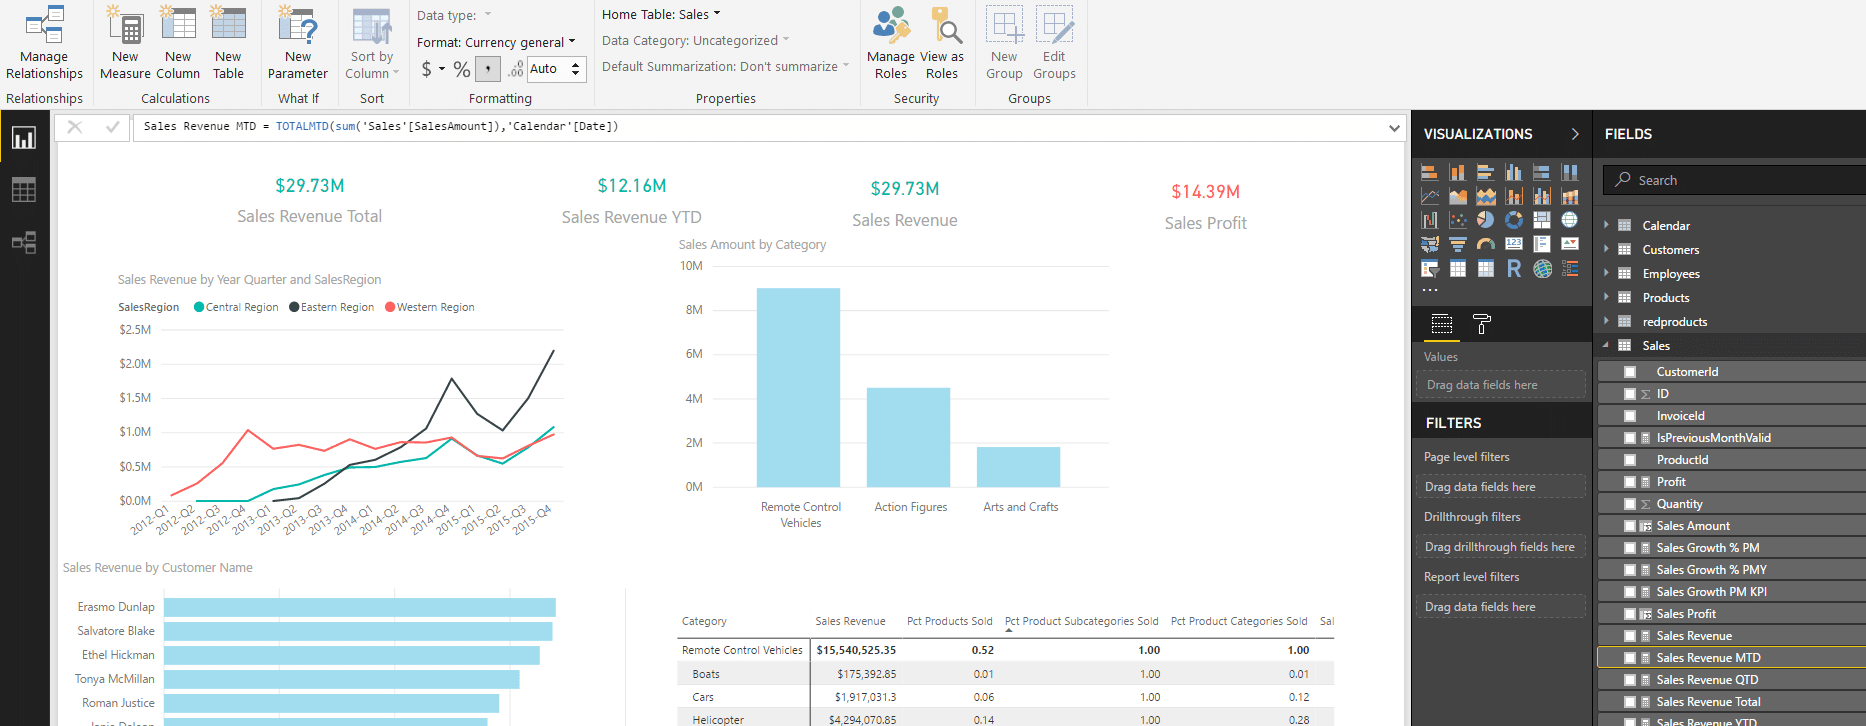
Enter this in the text bar: Sales Revenue MTD = TOTALMTD(SUM('Sales'[SalesAmount]),'Calendar'[Date])
The syntax is and function is the same as TOTALQTD except this is for the month to date.
Last Year Revenue
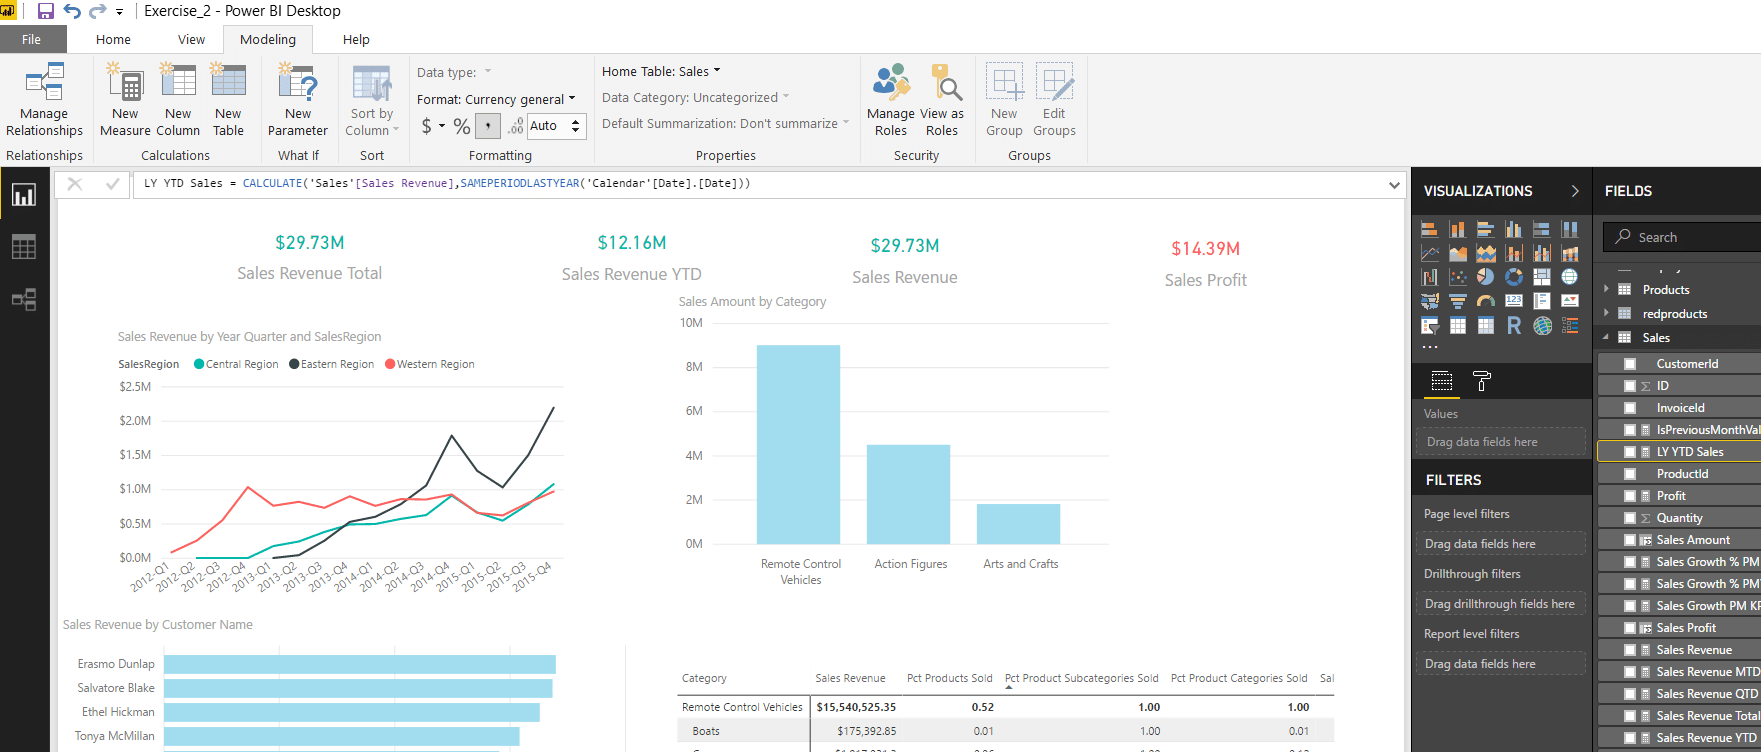
This calculation is a little different than the previous three. In this case, we have to use a function called SAMEPERIODLASTYEAR which shifts the date one year back in time from the date specified in our date column. We’re also using the CALCULATE function instead of SUM because CALCULATE allows us to change the filter context and use SAMEPERIODLASTYEAR as a filter.
LY YTD Sales = CALCULATE('Sales'[Sales Revenue],SAMEPERIODLASTYEAR('Calendar'[Date].[Date]))
Finally, we’ll calculate Rolling 12 Months revenue.

Rolling 12 Months is a lot different than the other time calculations we’ve done so far. There are other ways to achieve this calculation, however, we’ll use the one in this example. We’re also using the Sales Date from our Sales fact table rather than the Calendar Date.
Revenue TTM =
CALCULATE(
'Sales'[Sales Revenue]
,DATESINPERIOD(
'Sales'[SalesDate]
,MAX('Sales'[SalesDate])
,-12
,MONTH
)
)
Let’s read the expression from the inside out. We’re taking the maximum Sales Date from the Sales fact table to give us an endpoint in the data. After that, the DATESINPERIOD time intelligence function (DATESINPERIOD(<dates>,<start_date>,<number_of_intervals>,<interval>)) contains a column of dates that begin with the start_date, in our case the latest date we have a sales record in our Sales fact table, and continues for the specified number_of_intervals. Since we’re looking at a rolling 12-month period our number of intervals is 12. Also, notice in the DATESINPERIOD function we specified the interval by which to shift the dates as month. We could use year, quarter, or day as well.
Time intelligence functions in Power BI enable us to create calculations that span multiple time periods and relative time periods. We saw how to create to-date calculations for year, month, and quarter. Furthermore, we expanded our calculations to last year and rolling 12 months. These functions provide us with a lot of flexibility in reporting on time. These time intelligence functions can be utilized at any Power BI license level, but a Power BI Pro license is required to share data and reports with other Pro license holders. Click here to read more about Power BI Free vs Pro. Additionally, you can increase your reporting specificity and improve your data visualization by setting up a Power BI Hierarchy.

Under the terms of this license, you are authorized to share and redistribute the content across various mediums, subject to adherence to the specified conditions: you must provide proper attribution to Stoneridge as the original creator in a manner that does not imply their endorsement of your use, the material is to be utilized solely for non-commercial purposes, and alterations, modifications, or derivative works based on the original material are strictly prohibited.
Responsibility rests with the licensee to ensure that their use of the material does not violate any other rights.