


Power BI for Budgeting & Forecasting: Turning Numbers Into Real Insights
When our team sits down with finance leaders, the same themes come up again and again: budgets are messy, forecasts feel like guesswork, and the process takes too long. Everyone has spreadsheets, disconnected systems, and plenty of stress when it is time to pull the numbers together.
From my perspective, when it comes to budgeting and forecasting with Power BI, the world really is your oyster. Why? Because Power BI can take all those scattered pieces of financial data and automate the roll-ups, the manual formulas, the pivot tables and turn them into an evergreen picture of what is really happening in your business and where it is headed.
Bringing All Your Data Together
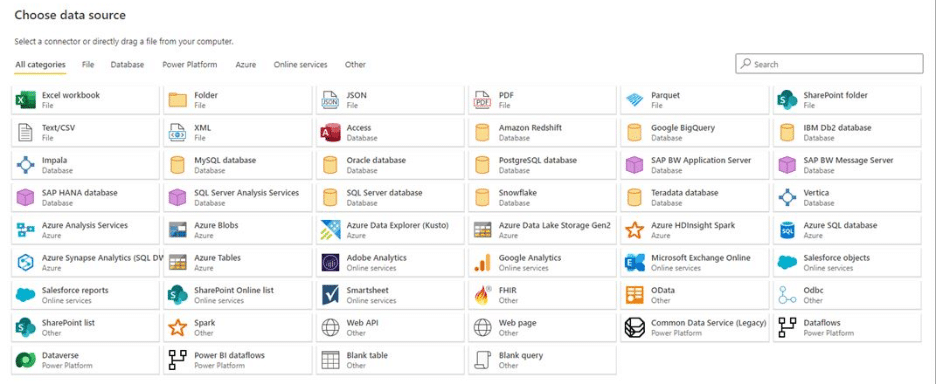
Think about where your budgeting and forecasting data lives today. A little bit in Excel, a little in your ERP system, and maybe a separate database for sales or inventory. With Power BI, you don't have to chase those numbers down. It connects to just about anything, including Dynamics 365 Finance, CRM, SQL, and even those infamous “Version 12_2025_final_v2.xlsx” spreadsheets.
Instead of juggling multiple sources, you finally have one place where everything lives. That is the first step to building trust in your numbers.
Visuals That Tell the Story
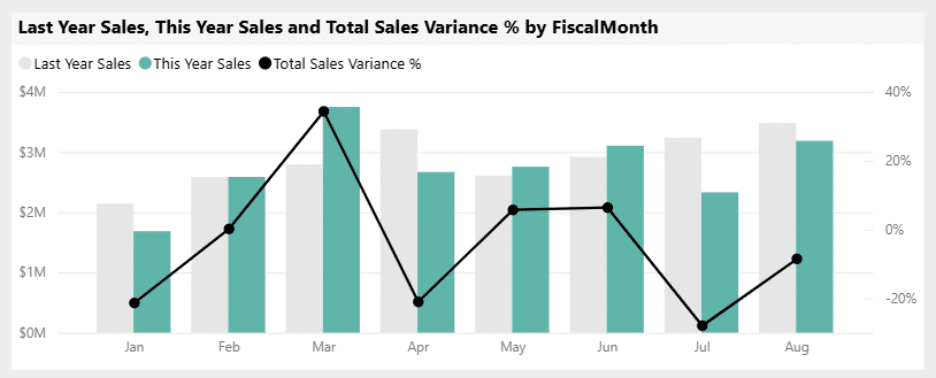
Once the data is in, the magic is in the visuals. You don't just get rows and rows of numbers. You get an at-a-glance picture of what's on track, what's off track, and what trends are shaping up.
- KPI cards that instantly flag whether you are meeting targets
- Year-over-year or month-over-month charts that show patterns
- Trendlines that help project future revenue or expenses
It’s amazing to hear a CFO say to me, “For the first time, I can present the story in the numbers.”
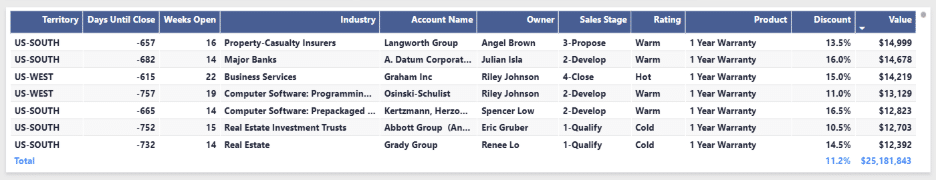
Drilling Down to the Details
Budgets don't only live at the 10,000-foot view, though. They live in the details. Power BI lets you click into any metric and drill down: region, department, product line, even the reason behind why you budgeted $1,000 this month or forecasted the need for 300 parts.
Instead of explaining numbers abstractly, you can show department heads exactly what is driving them. Conversations shift from defensive to collaborative.
Smarter Forecasting with AI
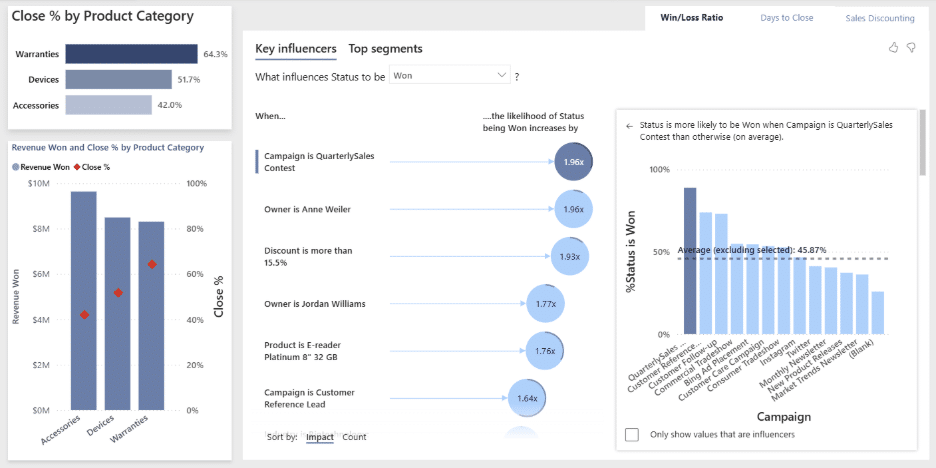
Here is where it gets fun. Power BI has AI-powered visuals that do some of the heavy lifting for you.
- Key Influencers highlight what is really driving cost increases or revenue swings.
- The Q&A feature lets you literally type a question, such as “What is driving overtime costs?” and Power BI builds the answer on the spot.
It is like having an extra analyst who never sleeps.
Empowering Finance Teams
The best part is that you don't have to wait for IT or a data team to create every report. Finance leaders and analysts can build their own dashboards, run their own scenarios, and share them securely.
Budgeting and forecasting stop being a once-a-year grind. They become living processes that help you adapt as quickly as the market does.
Finding Clarity in the Numbers
Budgets and forecasts will always take some effort. With Power BI, you get a clear, connected, and surprisingly intuitive way to keep the numbers meaningful.
That is why I keep coming back to that oyster analogy. With Power BI, you have the shell wide open, and the insights you need to make the right financial moves are sitting there, ready to be discovered.

Under the terms of this license, you are authorized to share and redistribute the content across various mediums, subject to adherence to the specified conditions: you must provide proper attribution to Stoneridge as the original creator in a manner that does not imply their endorsement of your use, the material is to be utilized solely for non-commercial purposes, and alterations, modifications, or derivative works based on the original material are strictly prohibited.
Responsibility rests with the licensee to ensure that their use of the material does not violate any other rights.