Software for Nonprofits: Improve Reporting and Data Insights with Dynamics 365 Business Central
Effective reporting is essential for any organization, and Dynamics 365 Business Central provides a powerful suite of tools for collecting, analyzing, and sharing data.
Nonprofits can use these features in Business Central to help in strategic decision-making and planning. Whether your organization is managing grants, or handling more complex business processes, Business Central features like dimensions, statistical accounts, financial reports, the analyze feature, and integrations with Power BI and Excel can help automate the management of these processes.
Optimize Your Data Reporting with Dynamics 365 Business Central
This blog will give you a comprehensive guide on why Business Central is a strong software solution for nonprofits who want to increase efficiency and consistency across their organization and improve the user experience.
Let’s break down the features listed above and provide more detail on how they can help your nonprofit succeed.
Dimensions and Statistical Accounts
Before we dive into how you can set up and configure these features, let’s define them:
What are Dimensions?
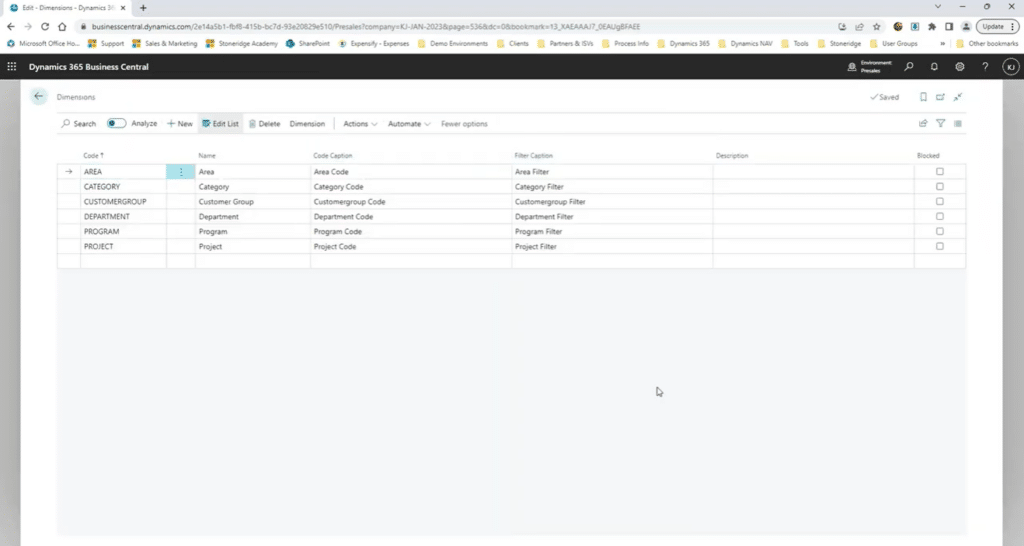
Dimensions are tags or categories you can assign to transactions to help track various aspects of your data. They allow for detailed analysis without complicating your chart of accounts.
What are Statistical Accounts?
These accounts are used to track non-financial data, like the number of meals served by a nonprofit or participants in a program, providing a deeper layer of insights.
Item Attributes
If your organization deals with inventory, you can also use item attributes. These can add additional details, such as color, size, or product category, enhancing data tracking and reporting.
Ensuring that you set up these features correctly during the implementation phase is crucial. For nonprofits, this often means setting up dimensions that align with common tracking needs like programs, projects, and grants.
How to Setup Dimensions and Statistical Accounts
Now that we have defined these features, let’s look at how you can set them up to work for your organization.
Setting Up Dimensions in Business Central
Dimensions are great for categorizing data in Business Central and allow you to track various data points without creating a complex web of accounts. Here are some easy steps on how to effectively use dimensions:
- Create dimension values: Dimensions can be set up with unlimited values. For example, if you have a dimension for projects, you can add as many projects as needed without limitations.
- Allow combinations: You can specify which dimension values are allowed for specific accounts, creating a matrix that controls how data is posted. This prevents errors and ensures consistency in reporting.
- Configure for grant tracking: If you're a nonprofit, you can set up dimensions specifically for grants, enabling you to track expenses and income by grant, which is crucial for compliance and reporting.
Using Statistical Accounts in Business Central
Statistical accounts allow you to capture non-financial data critical for performance analysis. For instance, nonprofits can track the number of meals served, participants reached, or other key metrics. Here are two key ways you can leverage statistical accounts:
- Extension-Based Statistical Accounts: Initially, statistical accounts were only available through extensions, such as those developed by partners like Stoneridge. These accounts helped GP users transition to Business Central by capturing non-financial data.
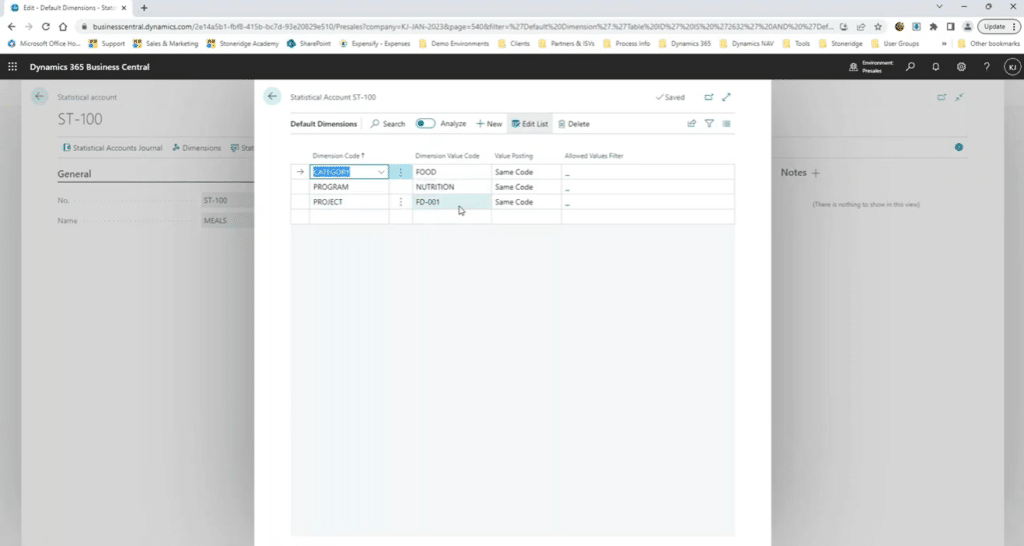
- Built-in Statistical Accounts: With recent updates, BC now includes native support for statistical accounts. You can create journals and post transactions, associating them with specific dimensions like programs or projects. This data can then be used in calculations, such as determining the cost per participant.
Exporting to and Analyzing Data in Excel
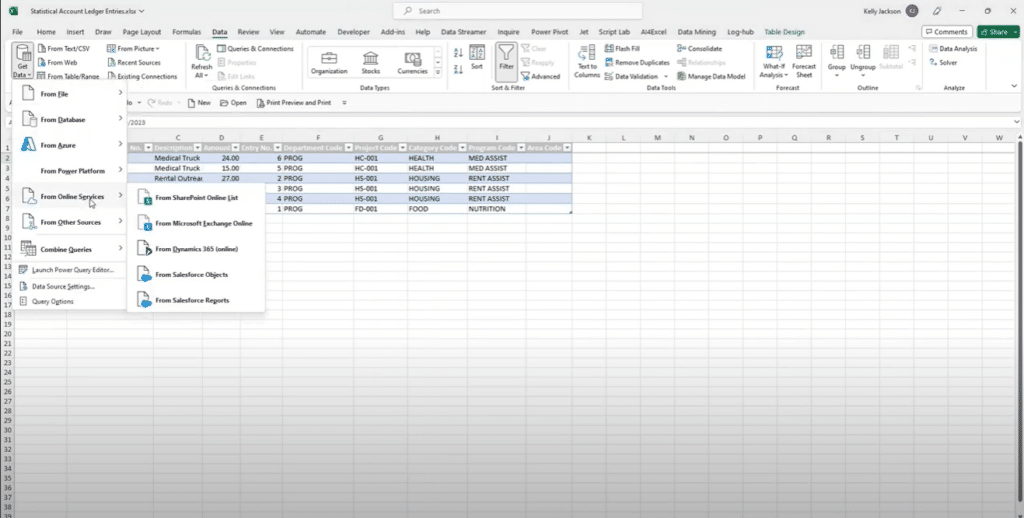
While there are newer ways, Excel remains a popular tool for data analysis, and Business Central's integration with Excel makes it easy to export data directly. You can work with data using:
- Pivot Tables: For advanced analysis, pivot tables allow you to reorganize data dynamically, providing a clear view of trends and metrics.
- Power Query and Power Pivot: These Excel features enable more complex data modeling and transformation, offering a deeper analysis without needing to leave Excel.
- Direct Data Connections: You can set up a direct connection between Excel and Business Central using Dynamics 365 online data sources. This allows real-time data analysis, ensuring your reports are always up to date.
Video Demonstration:
How to Use Financial Reports in Business Central
Financial reports, formerly known as account schedules, allow users to build custom financial statements by defining rows and columns, incorporating formulas, and leveraging statistical accounts for more dynamic insights.
Let’s break down these sections and how they tie into you effectively using financial reports.
Understanding Rows and Columns
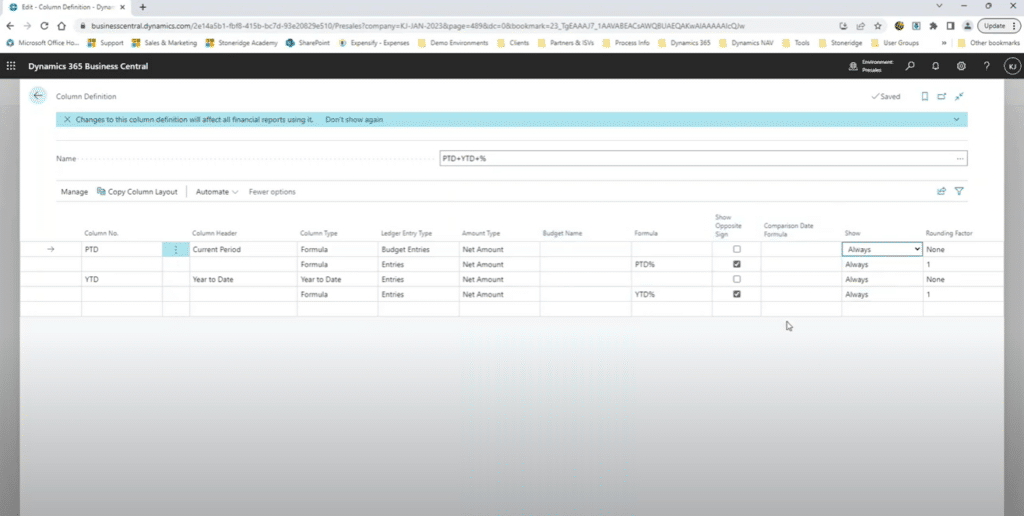
You can create financial reports by defining rows and columns separately. Row definitions allow you to outline the specific accounts or categories you want to include in the report. Column definitions set the parameters for your data, such as the periods or calculations.
You can configure these definitions to suit the needs or highly tailored reports with different analytical needs.
This flexibility means you can use the same row definitions with various column setups to generate multiple reports from the same base data.
Using Formulas in Financial Reports
Formulas within your column definitions perform calculations like summing specific rows or calculating percentages. For example, you can create a column definition that shows period-to-date values or directly calculates a percentage of total revenue in the report. You can also specify conditions to enhance a report's clarity and relevance.
You can also compare different periods, which helps you analyze trends, monitor performance, and identify areas of improvement.
How Statistical Accounts Factor into Formulas
Statistical accounts, detailed above, give you a holistic view of your organization’s performance. You can incorporate them into your formulas to track non-financial data such as employee headcount or production units. You can also combine them with traditional financial data in the same report.
Creating Customized Reports with Formatting Options
Business Central’s financial reporting tool also provides options for visual customization, such as adding double underlines to totals or specific formatting to highlight important figures. You can also create custom total lines that sum selected rows or apply unique calculations, such as dividing one set of data by another to derive key performance ratios.
These customization features enhance readability and ensure stakeholders can quickly identify the most critical information in the report.
Financial reports in Business Central offer a flexible way to analyze financial and operational data. This gives you an easy-to-understand yet comprehensive view of your business performance.
Video Demonstration:
Analyze Feature: Bring Pivot Tables Directly into Your Business Central Environment
A newer feature in Dynamics 365 Business Central, Analyze allows you to analyze data directly within the system. It functions very similar to the way pivot tables work in Excel. It gives you a more dynamic way to manipulate and visualize your data without exporting it to another platform.
How to Use the Analyze Feature in Business Central
To open the Analyze feature, navigate to a page with entries or data columns such as your General Ledger (GL) Entries page. Once you are on that page, switch the “Analyze” toggle near the top to on.
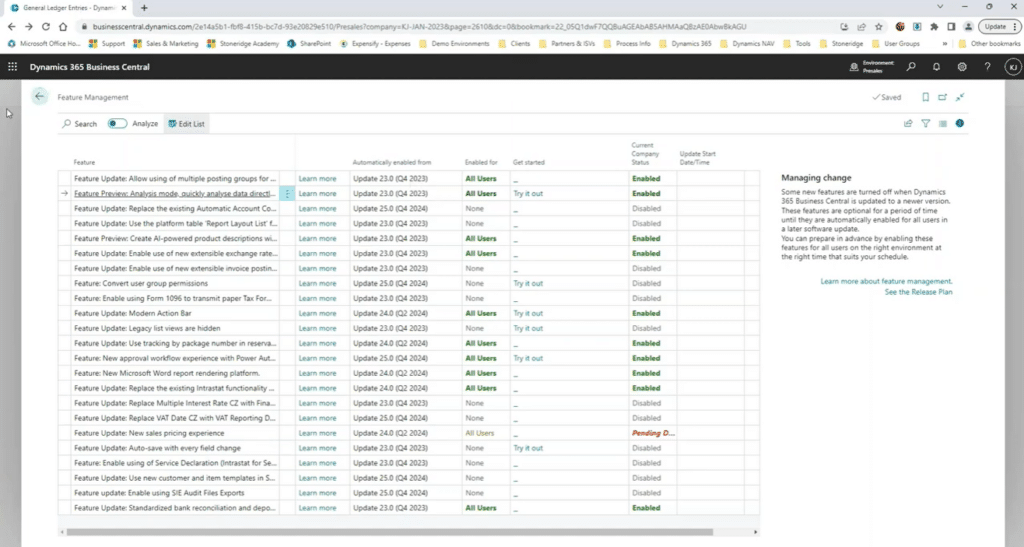
If you don’t see it, go to the Feature Management page and ensure it is enabled. Search for it at the top or scroll down until you find it. Once you do, activate it and go back to your GL entries page it should be there. Once you hit the analyze button, you will trigger a flexible workspace to open where you can filter, sort, and manipulate your data using the aforementioned column and row settings.
Here are some helpful hints for creating an analysis and using the Analyze feature:
Creating An Analysis
After the workspace opens, you will see the available column and data fields from your selected page. You can customize the analysis view by applying filters, sorting columns, and choosing which data you want to display. Here are some specifics:
- Setting Up Filters: Filters are essential in the Analyze feature, allowing you to narrow down the data to just what you need. The system offers a wide range of filtering options to tailor your analysis to your requirements.
- Using Pivot Mode: You can drag and drop fields, just like in Excel, and reorganize data on the fly.
Saving and Managing Analyses
Once you are done setting up your analysis, you can save it with a custom name. We recommend setting up naming conventions so you and your team members can find the files they need quickly.
You can save multiple analyses in a single data set, each geared towards a different need. Naming them clearly, like “Revenue Pivot” or “Expense Analysis” will help keep your workspace organized.
You can also easily delete an analysis, ensuring your workspace stays relevant and uncluttered.
Navigating Between Data Set and Maintaining Analysis Consistency
One of the most convenient features of the Analysis Feature is its ability to save analyses as you navigate between different data sets within Business Central. For instance, if you switch from reviewing general ledger entries to statistical accounts and then return to the general ledger, your saved analyses will still be available.
This continuity means you can pick up where you left off, saving time and maintaining consistency in your reporting.
Video Demonstration:
Power BI in Business Central: Smarter and More Effective Reporting
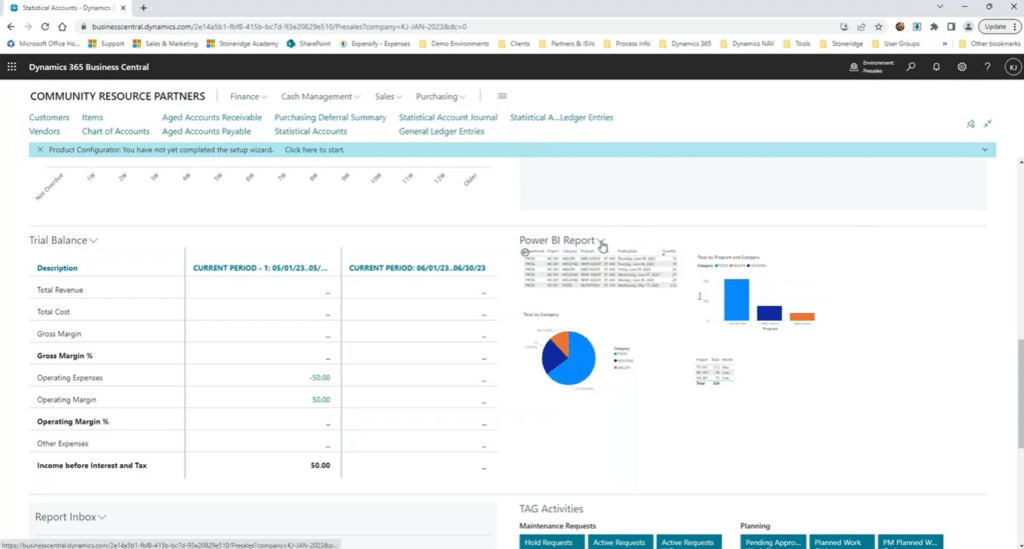
Power BI enhances data accessibility, interactivity, and collaboration. This makes it a powerful tool for business analysis and decision-making. You can embed Power BI reported directly in Business Central, allowing users to interact with and analyze data without leaving the platform.
Here are some key benefits of integrating Power BI with Business Central:
- Expanding and Managing Reports: Users can expand Power BI reports within Business Central to get a larger view or make changes, such as applying filters and adjusting data slices. This flexibility helps tailor the reports to specific analytical needs.
- Connecting to Data Sources: Power BI easily connects to various data sources within Business Central, including recent connections and other environments. Users can pull data from standard APIs, legacy services, or external sources like Excel workbooks, allowing for comprehensive data analysis.
- Building Data Models: Users can specify relationships between data fields, ensuring seamless integration and accurate report generation.
- Customization of Reports: Power BI offers extensive customization, including changing column names, adjusting visuals, and linking tables.
- Dynamic Interaction and Visualization: Within Power BI, users can interact with different data points across multiple charts, enabling dynamic updates and insights. Clicking data in one chart automatically filters related data across other visuals, enhancing interactivity.
- Sharing and Access: Power BI reports embedded in Business Central can be shared across the organization, including within Microsoft Teams channels. This promotes collaboration and ensures that key insights are accessible to relevant stakeholders.
- Versatility of Reports: Users can access a variety of Power BI reports saved in their workspaces, including reports shared by others. This ensures that all relevant data and analyses are available directly within the Business Central environment.
Video Demonstration:
Want to Learn More About Using Dynamics 365 Business Central for Your Nonprofit?
Get in touch with the team of experts at Stoneridge Software! Our team is knowledgeable in both Business Central and Power BI and can help you get the most out of these solutions. We have also worked with nonprofit organizations before and can help you assess your needs and whether Business Central can help you solve some of your unique challenges.
Under the terms of this license, you are authorized to share and redistribute the content across various mediums, subject to adherence to the specified conditions: you must provide proper attribution to Stoneridge as the original creator in a manner that does not imply their endorsement of your use, the material is to be utilized solely for non-commercial purposes, and alterations, modifications, or derivative works based on the original material are strictly prohibited.
Responsibility rests with the licensee to ensure that their use of the material does not violate any other rights.


