Troubleshooting A Slow Interactive Process Using LCS Monitoring in Dynamics 365 Finance and Operations
A slow system is one of the most frustrating issues to deal with, luckily, you can use the LCS Monitoring in Dynamics 365 Finance and Operations to rectify this issue and get back on track.
This issue typically comes up when you are running an interactive process in Dynamics 365 Finance and Operations. An interactive process is when you take an action that "interacts" with the system. Some examples of interactive processes you might complete include:
- Creating sales order
- Setting sales orders for direct delivery
- Manually created (Asset) work orders
- Posting payment (to Bank)
LCS Monitoring Tool in Dynamics 365 Finance and Operations Ensures Diverse Troubleshooting Measures
Dynamics 365 Finance and Operations captures a large number of logs called telemetry that you can use to troubleshoot. Before troubleshooting with the LCS monitoring tool, it's essential to obtain the following information from either your system or from the user who is having the issue:
- Approximate Date/time range (closer the better) with time zone information
- User Telemetry ID of the user experiencing the issue, and optionally Browser Session ID
- As much details as possible with the slow interactive process
- Actual and expected time duration
While there are several tools you can use to troubleshoot this issue, LCS - also known as Lifecycle Services - is very versatile when compared to other methods. For example:
- Trace is a common troubleshooting option that works best if the issue can be replicated
- Debugging is a more intrusive tool that works best with replicated scenarios and in a development environment
While both of these tools work, LCS monitoring can accomplish the same goal with limited telemetry. It can also be used in non-replicated scenarios in addition to replicated ones.
How to Troubleshoot a Slow System with LCS Monitoring in Dynamics 365 Finance and Operations
By following these two steps, you should be able to troubleshoot your lagging system.
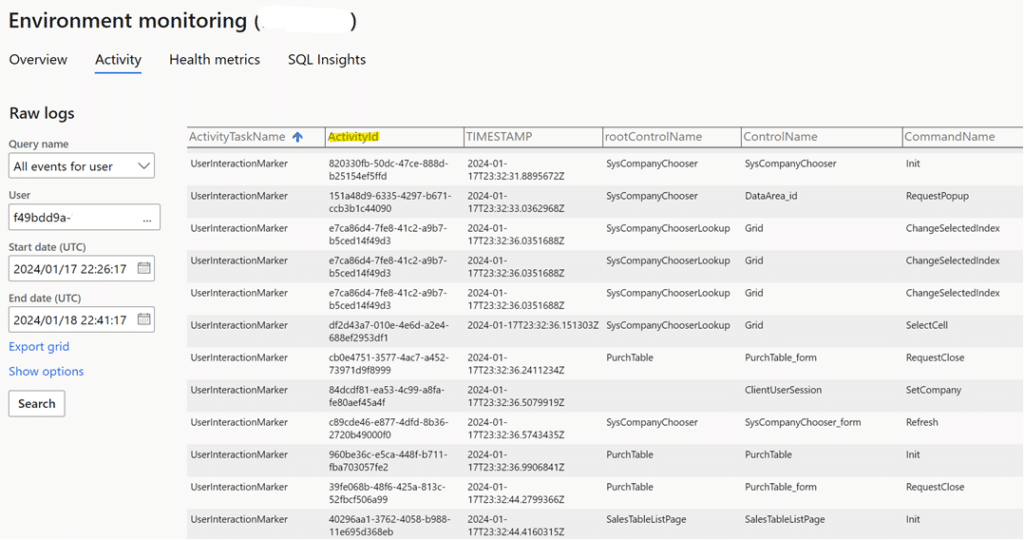
1) Identify the ActivityId of the slow interactive process
Under Activity > Monitoring environment in the LCS monitoring tool, you can use the User Telemetry ID in “All events for user” to capture the following information:
- Start/End Date (UTC): Date/time range in UTC time zone where the slow interactive process may occur
- The User field is the User Telemetry ID of a user with a slow interactive process you identified earlier
- Export grid: Option to export to Excel (recommended)
- Row limit: Default is 50 that you may want to expand to max like 5,000
- Date time in UTC: Recommend setting Yes to be time-neutral (especially when you look for assistance from others not in the same time zone as you do)
Each row represents some sort of user action. The first thing you do is to sort the timestamp either in ascendant or descendant order to ensure all user action is listed chronologically.
The rootControlName, ControlName, and CommandName are typically very foreign to many users, especially those who are not as technical. rootControlName refers to the form or page name while ControlName is the interactive media, such as a button or a table/Grid. The CommandName is the interactive action, for example, Click and Select. For example, the sequence of SalesTable > SalesTable > Init refers to action when a sales order detail form is opened or initialized. Another example like SalesTable > buttonCreateDropShipment > Click suggests a button in a create or New group called "Drop Shipment" or "Direct Delivery".
2) List all activities from ActivityId of the slow interactive process (alternatively)
Alternatively, you can also use "Slow Interfactions" to identify the ActivityId by matching the TIMESTAMP and Alias (User Telemetry ID).
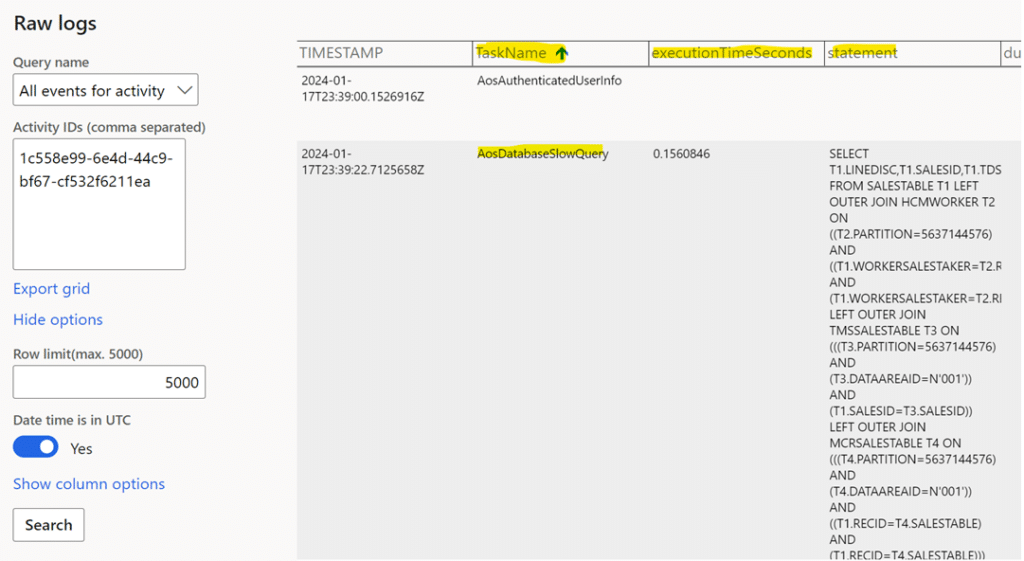
3) Pull the details by the ActivityId using "All events for activity"
This requires a more in-depth investigation. One quick way to investigate is to locate the "AosDatabaseSlowQuery" in TaskName to examine if the executionTimeSeconds is taking up too much time or is a large portion of reported process time. The statement indicates the possible slow SQL statement.
Want to Learn More About Troubleshooting in Dynamics 365 Finance and Operations?
Get in touch with us! Our D365 Finance and Operations team can help you address the system inquiries you have and assist you in troubleshooting issues.
Under the terms of this license, you are authorized to share and redistribute the content across various mediums, subject to adherence to the specified conditions: you must provide proper attribution to Stoneridge as the original creator in a manner that does not imply their endorsement of your use, the material is to be utilized solely for non-commercial purposes, and alterations, modifications, or derivative works based on the original material are strictly prohibited.
Responsibility rests with the licensee to ensure that their use of the material does not violate any other rights.


