


Getting Started with Jet Express for Dynamics NAV, Dynamics AX and Dynamics GP
Jet Reports is a complete reporting tool that connects to databases in Microsoft Dynamics AX, NAV, and GP. More than 137,000 users and 10,000 companies currently use Jet Reports, spanning more than 90 countries. It offers three tiers of functionality: Jet Express (free), Jet Professional, and Jet Enterprise. Jet Professional and Jet Enterprise offer functionality for more complex reporting needs. Jet Express however, is a convenient and easy-to-use add-on to Microsoft Excel that can easily connect to your Dynamics NAV, AX or GP database to run real-time reports. Today, we will be focusing solely on running a simple report in Jet Express.
Downloading Jet Express
1. Go to https://www.jetreports.com/jet-express/
2. Select your platform: NAV or GP
3. Scroll down and click “Download Now”
4. Fill out the form on the right and click “Access Resource”
5. Click the link in your email to download Jet Express Setup
6. Follow the prompts in the Setup and select the “Launch Jet Reports” checkbox before clicking Finish
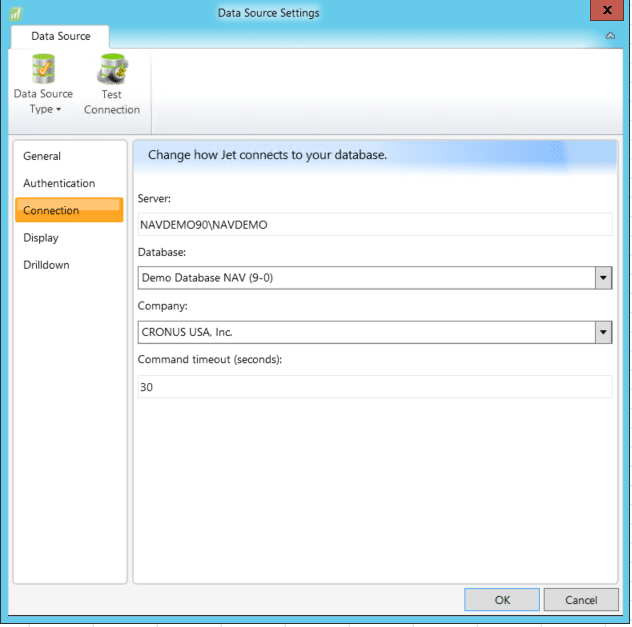
You should now have an Excel window open with a new tab on your ribbon labeled “Jet”. The next step is to connect to your NAV database. Click the Jet tab, and then click Data Source Settings in the Settings group.

Configure the fields on the Connection tab to connect. Once the correct server is listed, the Database and Company values should be available in the dropdown menus.
Building a Report
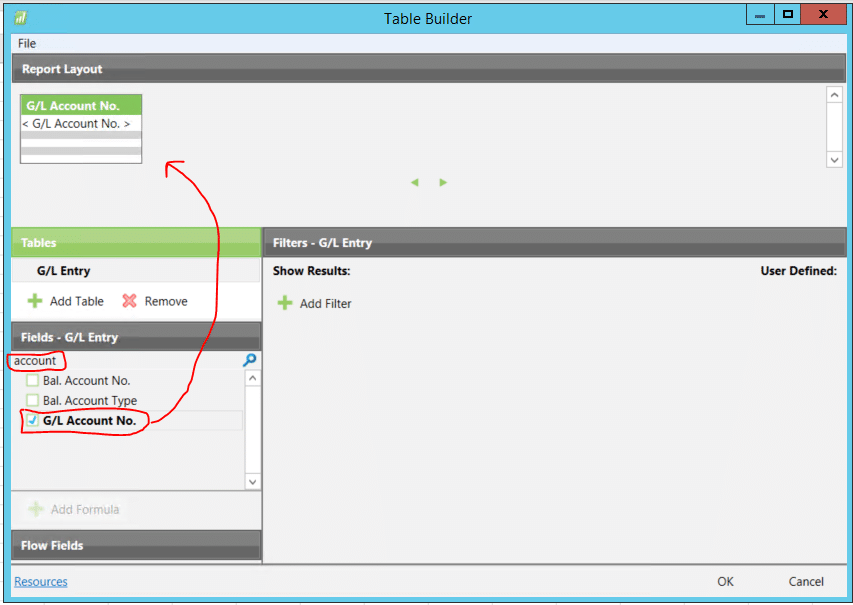
To build your report, click the Table Builder button in the Design Tools category. Next, choose the table that houses the data you wish to see by clicking the “Add a Table” button. From here, you can choose which fields you wish to display when your report runs. They can also be searched on when your table is selected. Simply check the box of the field to add it to your report.
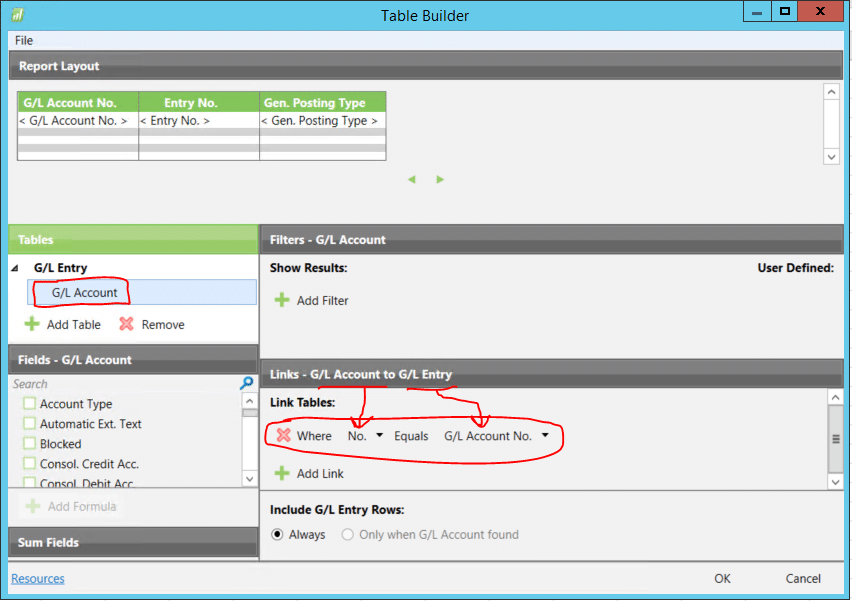
Linking Tables
You aren’t restricted to simply reporting on one table at a time. To link another table to the existing table, highlight the source table under “Tables” and click the “Add Table” button. Once the added table appears in the “Tables” section and is highlighted, you can choose which fields map to each other between the tables in the Links section at the bottom of the main window pane. Most of the time, Jet can guess which fields match to each other and will auto-populate them. If not, you can manually select the two fields to add the link. Now that your second table is added, you can add fields from this table to display.
Ordering the Display Columns
Once your fields are selected you can move around the order of how they’ll be displayed by dragging around their boxes on the header into the correct sequence.
Filtering
Filtering is an important feature of reporting. In order to filter on a value, click on the table name below the “Tables” header. Click “Add Filter” and then choose a field you would like to filter on. Any field can be filtered on, not just the ones displayed. If you wish to run this exact report multiple times or in the future with different parameters, click the “User Defined” checkbox on the right side of the box. This means users will be able to change these filter parameters after the report is created and before it is re-run in future iterations. From there click OK to finalize your report.
IMPORTANT CAVEAT: When using Jet Express, you cannot save your report layout template in Table Builder to modify for future use. This is one advantage of upgrading to Jet Professional. Once you click OK, you will need to start from scratch to build the report over again.

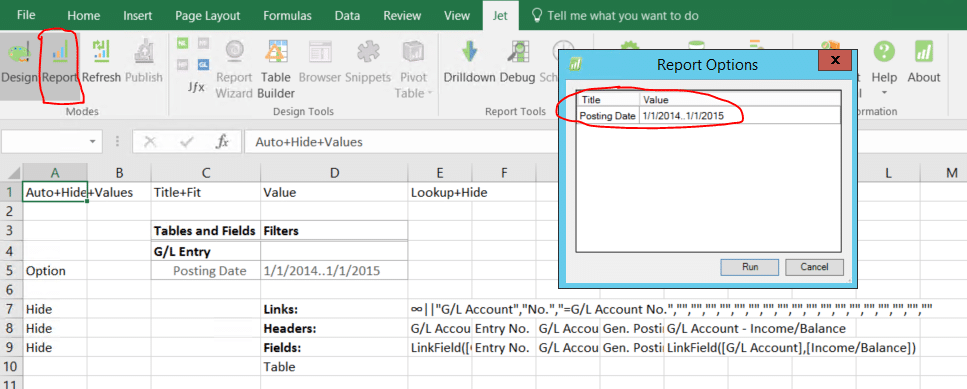
You should now see cells filled in with the “guts” of your report. If you understand what the cells mean, you can modify your report to rerun with different fields and parameters, but for now we will not pay any attention to these cells. To run your report, click the Report button on the left side of the Jet ribbon. If you’ve marked any filters as “User Defined” you’ll see them pop up with the ability to change their values before the report runs.
Now that you have your report in table form, you can do whatever you wish with it. Filter it. Sort it. Add other columns to add custom formulas. Convert it into a PivotTable with slicers for easy filtering. However, the next time you click Refresh to rerun the report, everything on this sheet will be removed and replaced with the updated data. Again, Jet Express is primarily used for ad-hoc reports rather than total report automation.
So there you have it. You’ve now made a report in Jet Express! Congratulations are in order.

Under the terms of this license, you are authorized to share and redistribute the content across various mediums, subject to adherence to the specified conditions: you must provide proper attribution to Stoneridge as the original creator in a manner that does not imply their endorsement of your use, the material is to be utilized solely for non-commercial purposes, and alterations, modifications, or derivative works based on the original material are strictly prohibited.
Responsibility rests with the licensee to ensure that their use of the material does not violate any other rights.