


How to Access Filtered Power BI Paginated Reports in D365 Customer Engagement with Power Fx
Accessing Power BI paginated reports into your Dynamics 365 Customer Engagement (CE) environment has never been easier.
By just clicking on one button within your CE form, you can access a dynamic and pre-filtered Power BI report tailored to that exact document. Maybe you are in the middle of reviewing a sales quote and want a formatted summary to print or send off. Previously, opening Power BI, searching for and finding the right report, and manually filtering the results were too many steps.
Watch the video tutorial on our YouTube channel:
In this blog, we will show you how easy it is now to access these reports in a flash and why it’s an important development in boosting efficiency within your business.
Why Accessing Power BI in Dynamics 365 Customer Engagement is Important
This feature works for all Dynamics 365 CE solutions, however, for this blog we will use the example of a user working on a quote, on a particular record on a form, within Dynamics 365 Sales. By simply clicking a button, the user can immediately see a Power BI paginated report tailored to that exact quote.
The kicker is that you can do this with no complex coding or scripting needed. Through Power Fx, you can create this experience with just a few lines of code.
A Quick History of How Power BI Filtered Reports and Customer Engagement Work Together
Before we dive into how you can accomplish this, let’s take a brief look at how the integration between these tools has evolved. In the past, embedding contextually filtered reports into CE forms required custom development such as JavaScript, web resources, iframes, or third-party tools. Some organizations relied on the now-deprecated Power BI components feature, which allowed for deeper contextual integrations via JSON. This feature was phased out in 2023.
What is available now is much simpler, maintainable, and accessible. Power BI paginated reports and Power Fx are not brand-new features, but it is a refined and modern solution that works quickly and effectively.
Bringing It All Together: Power BI paginated and Dynamics 365 CE in Action
Now that you understand how this feature came to be and why it’s important, let’s dig into how you can do this:
Prerequisites
Before you begin, make sure you have the following in order:
- Access to and familiarity with Power BI Report Builder
- Power BI Pro license and a workspace in the Power BI Service
- Access to Power Apps Maker Portal
- A Dynamics 365 CE environment with a suitable table (like Quotes)
- Basic familiarity with CE forms and Power Fx
Step 1: Build the Paginated Report
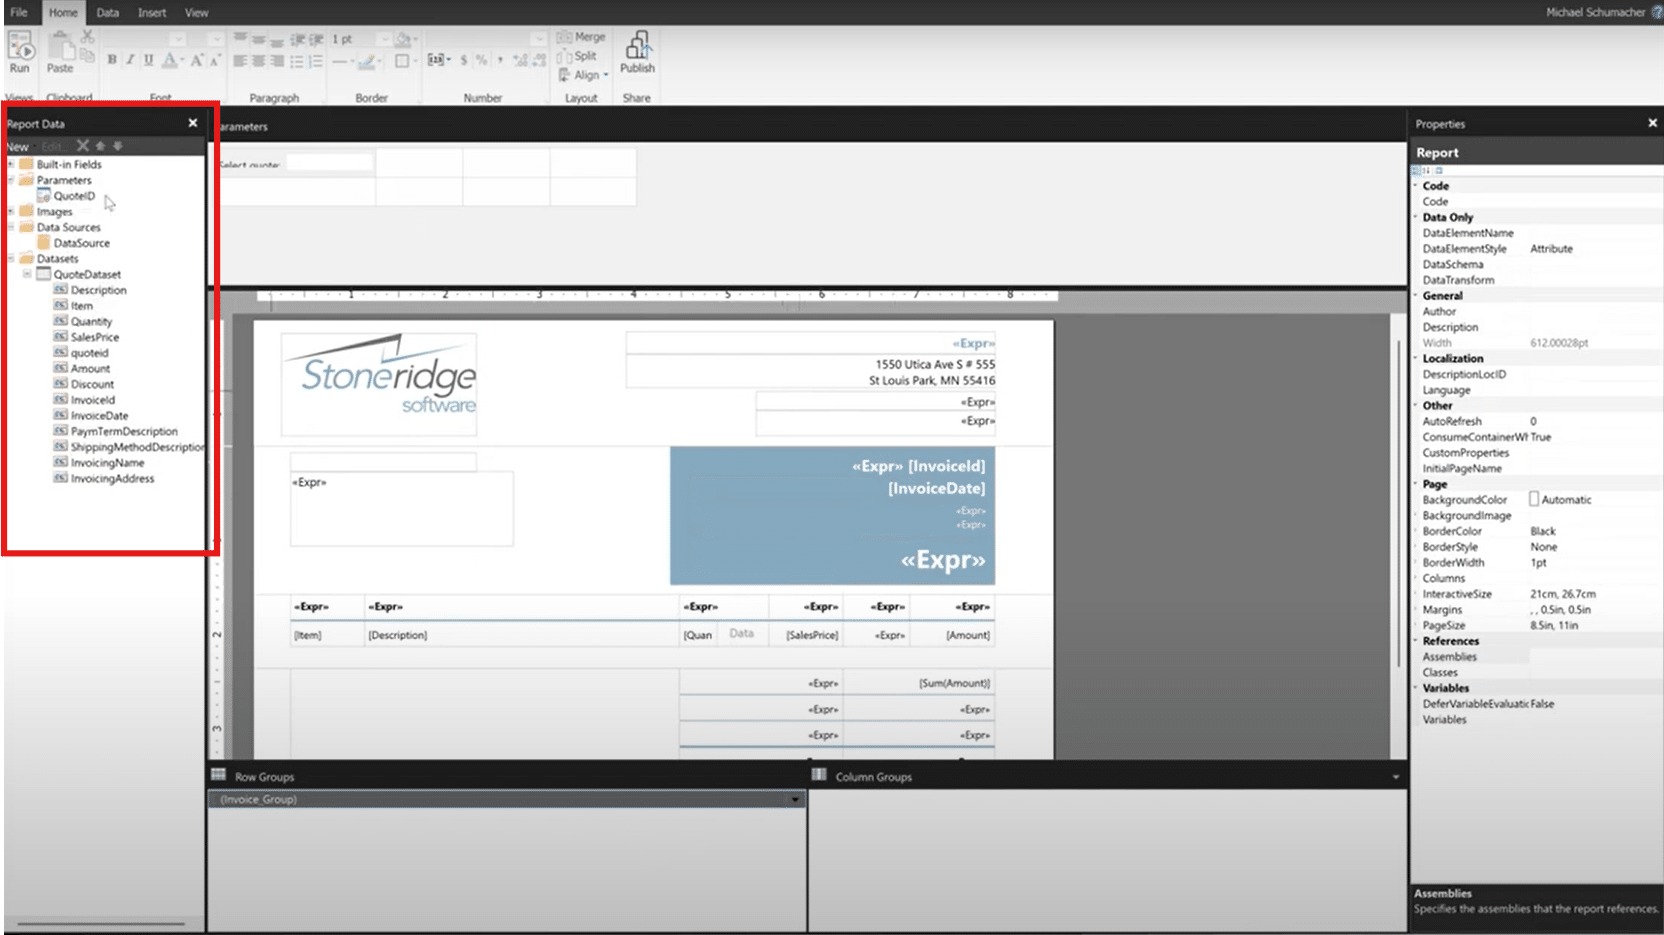
Paginated Reports are ideal for scenarios where your end goal is printing or exporting documents such as quotes, invoices, or professional summaries. You can create one by following these steps:
- Open Power BI Report Builder.
- Use the Dataverse connector (left-hand-side of the screen) to connect to your environment.
- Create a dataset pulling fields from the table you’re targeting (e.g., Quotes and related data).
- Add a parameter to the report:
- Name: quoteID (or similar)
- Type: Text
- Purpose: To filter the report to the current CE record
- Build your report layout—this can be as simple or complex as needed.
- Test the parameter locally by entering a valid GUID manually.
Step 2: Publish the Report to Power BI Service
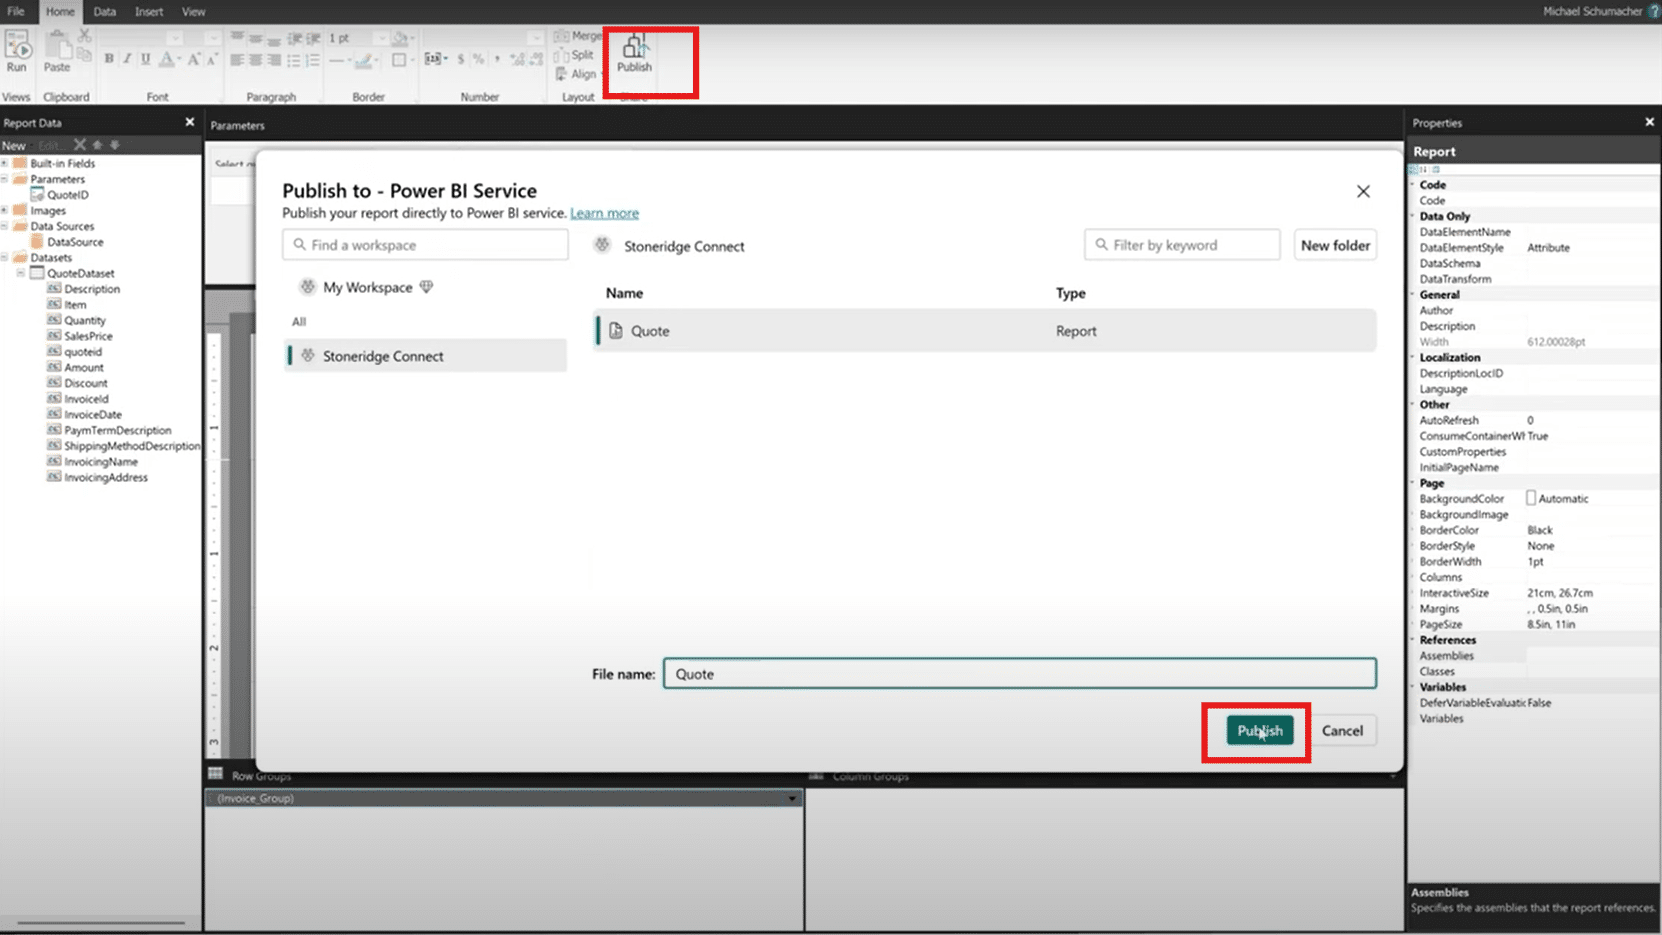
- In Report Builder, click Publish.
- Choose a Power BI workspace to publish to.
- Give your report a name (e.g., QuoteSummaryReport).
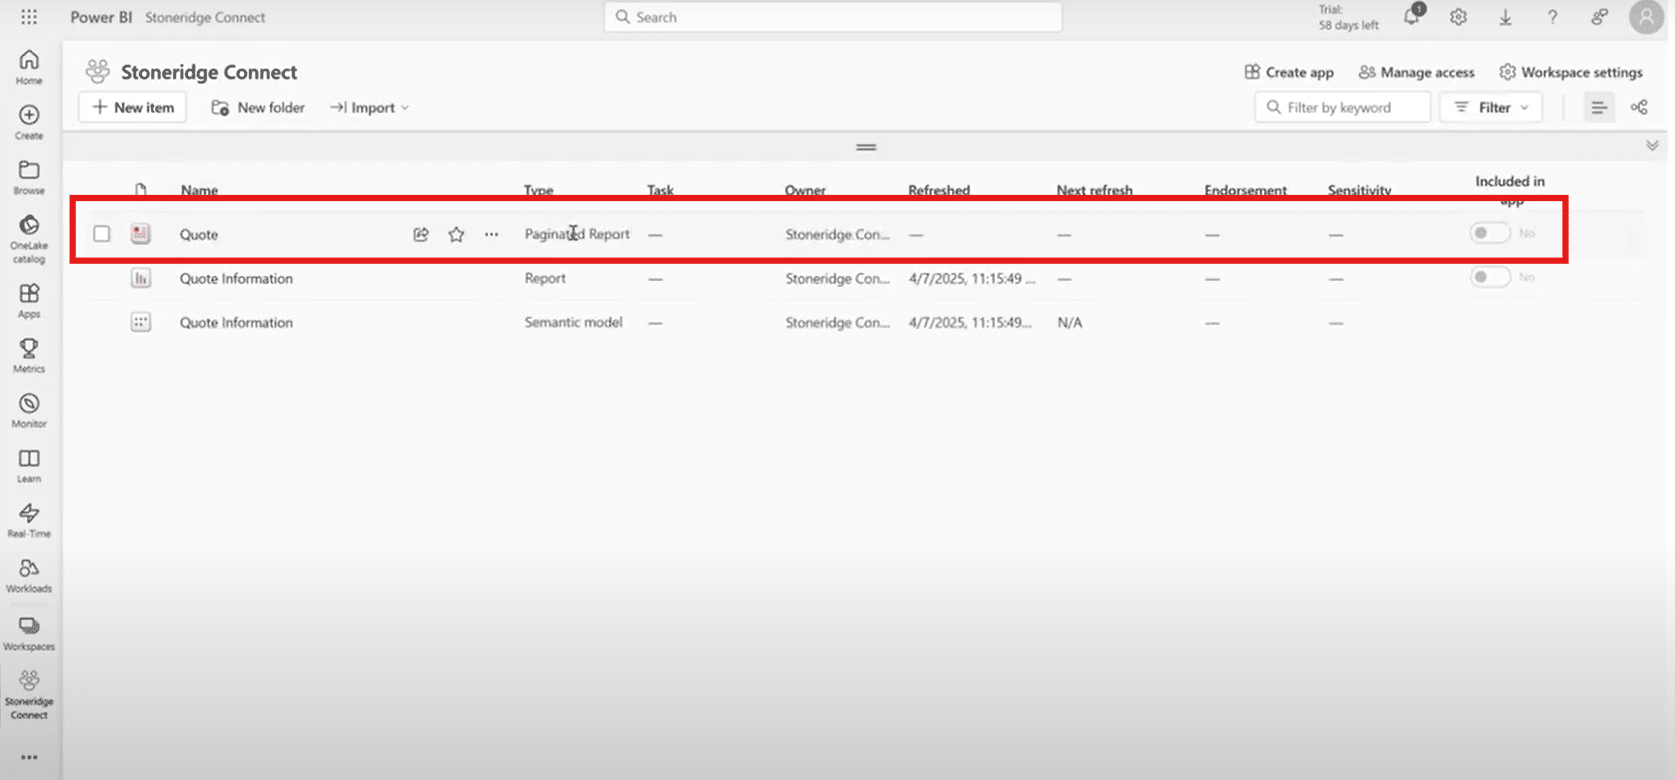
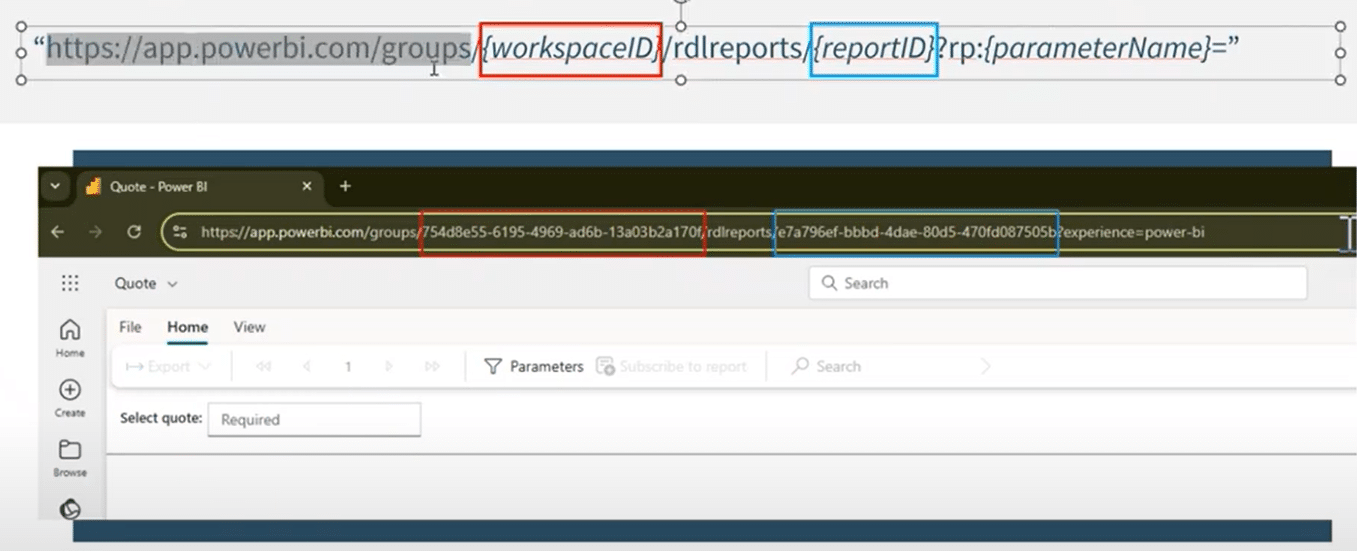
- After publishing, go to PowerBI.com, open the report, and copy the following from the URL:
- Workspace ID (a.k.a. Group ID)
- Report ID

- Example URL:
- https://app.powerbi.com/groups/<workspaceID>/rdlreports/<reportID>?experience=power-bi
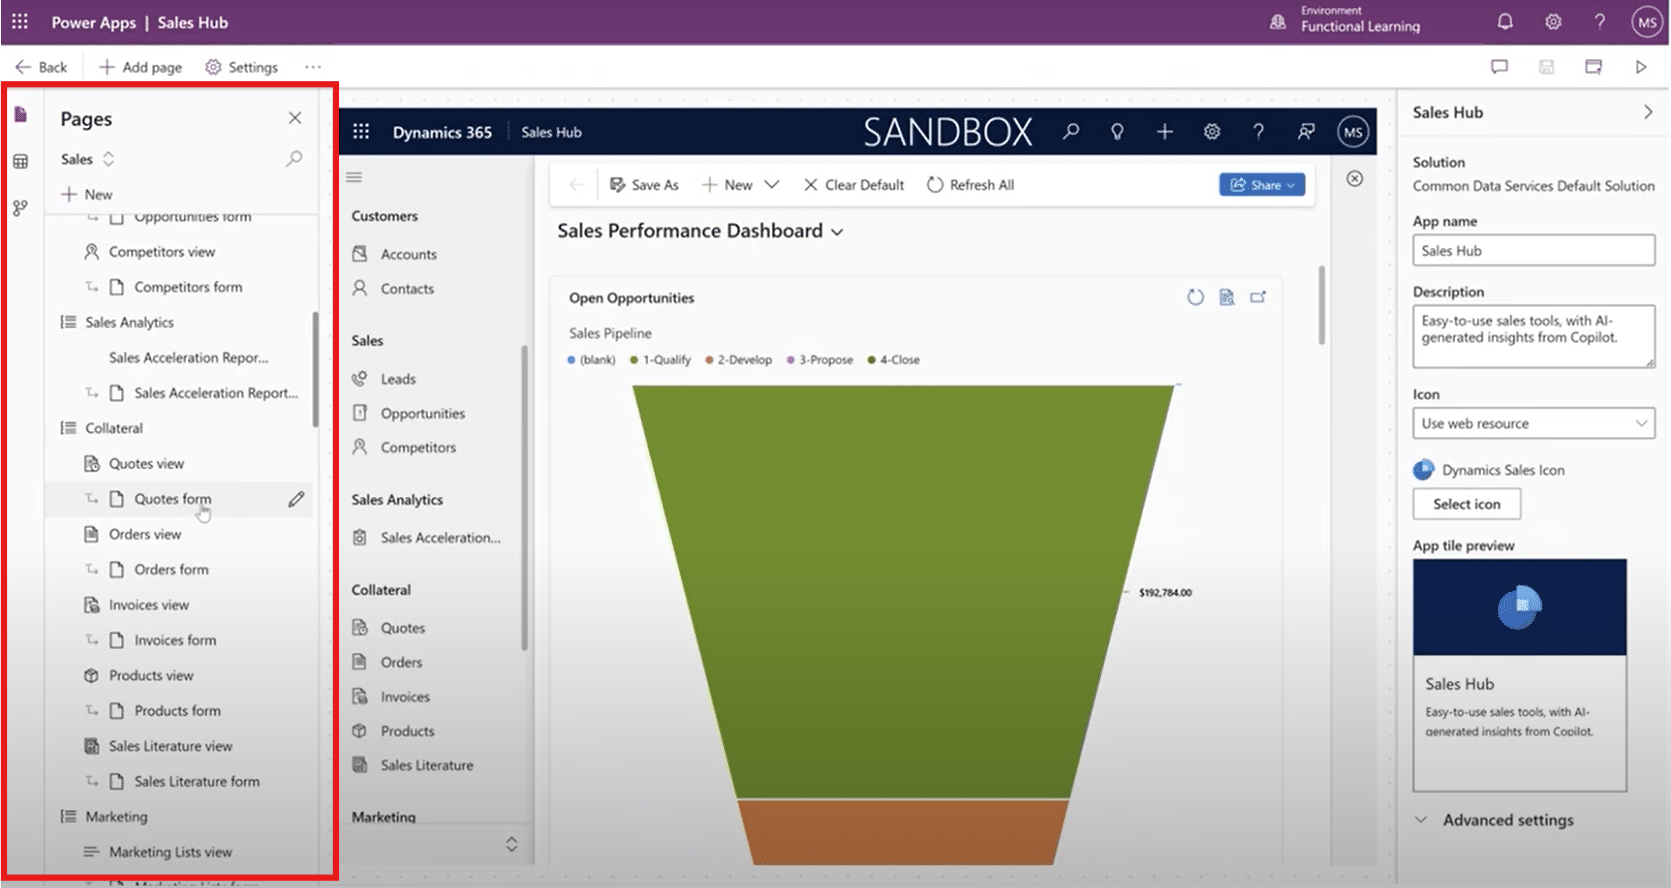
Step 3: Edit the Command Bar in Power Apps
- Go to the Power Apps Maker Portal.
- Choose the correct environment and open your Sales Hub app.

- In the left navigation, go to Tables > Quotes (or your target entity).
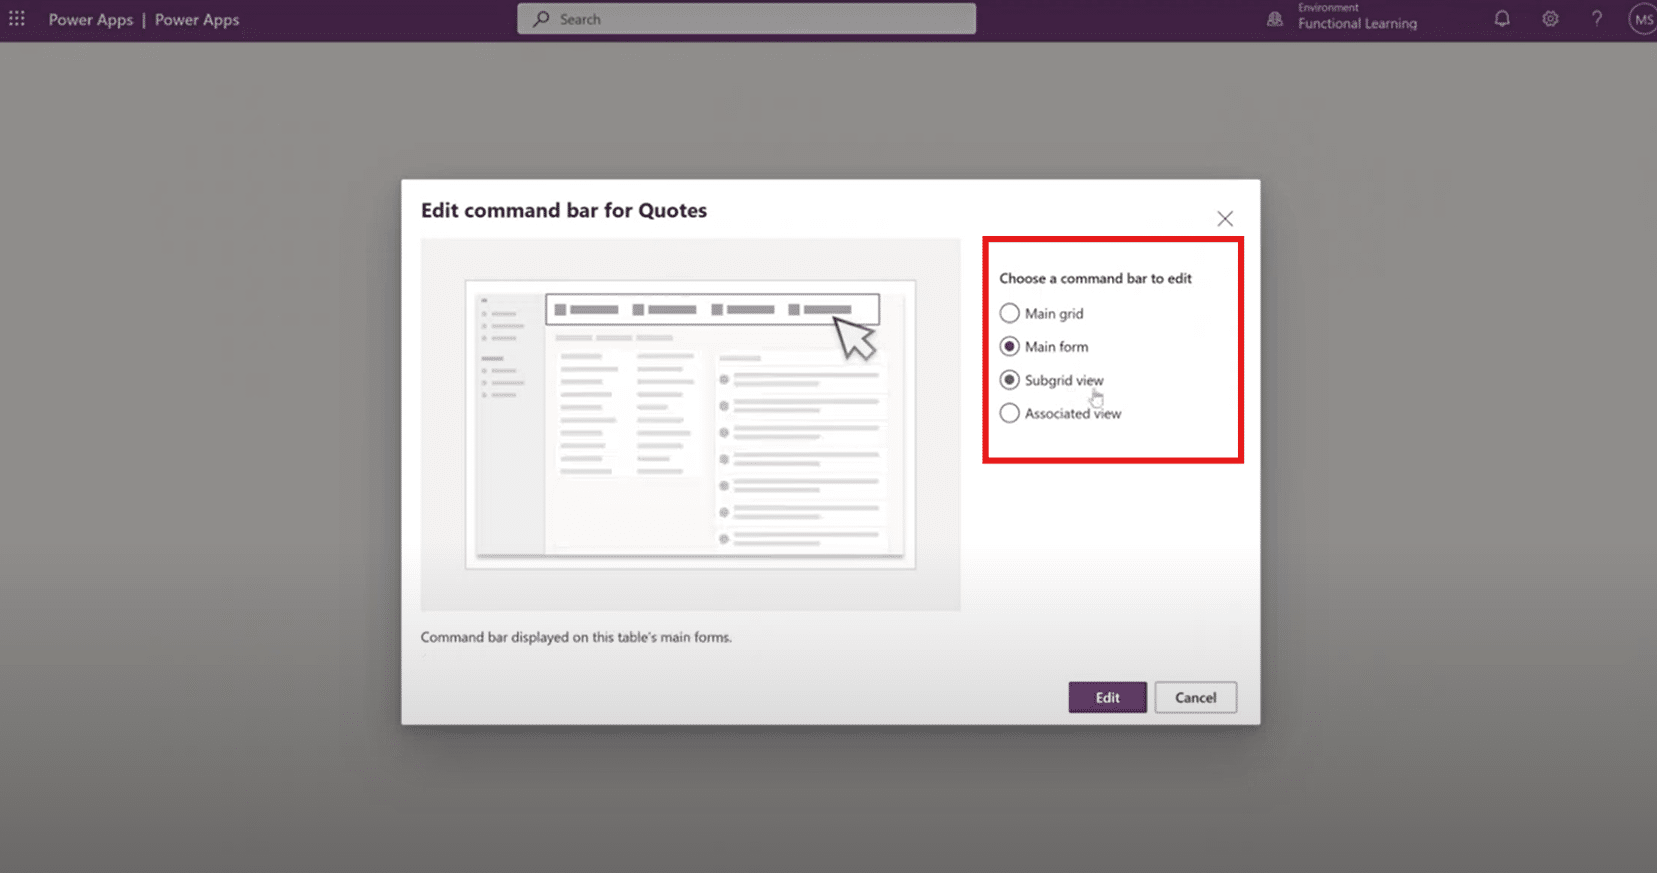
- Click the ellipsis (...) next to Quotes and select Edit command bar.

- When prompted, choose Main form (not main grid or subgrid).
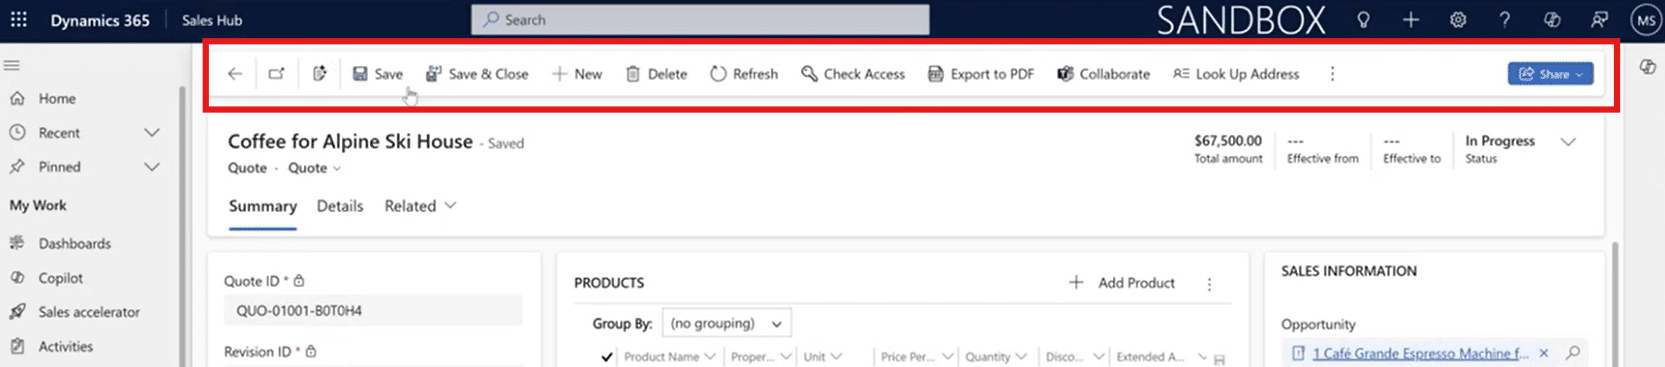
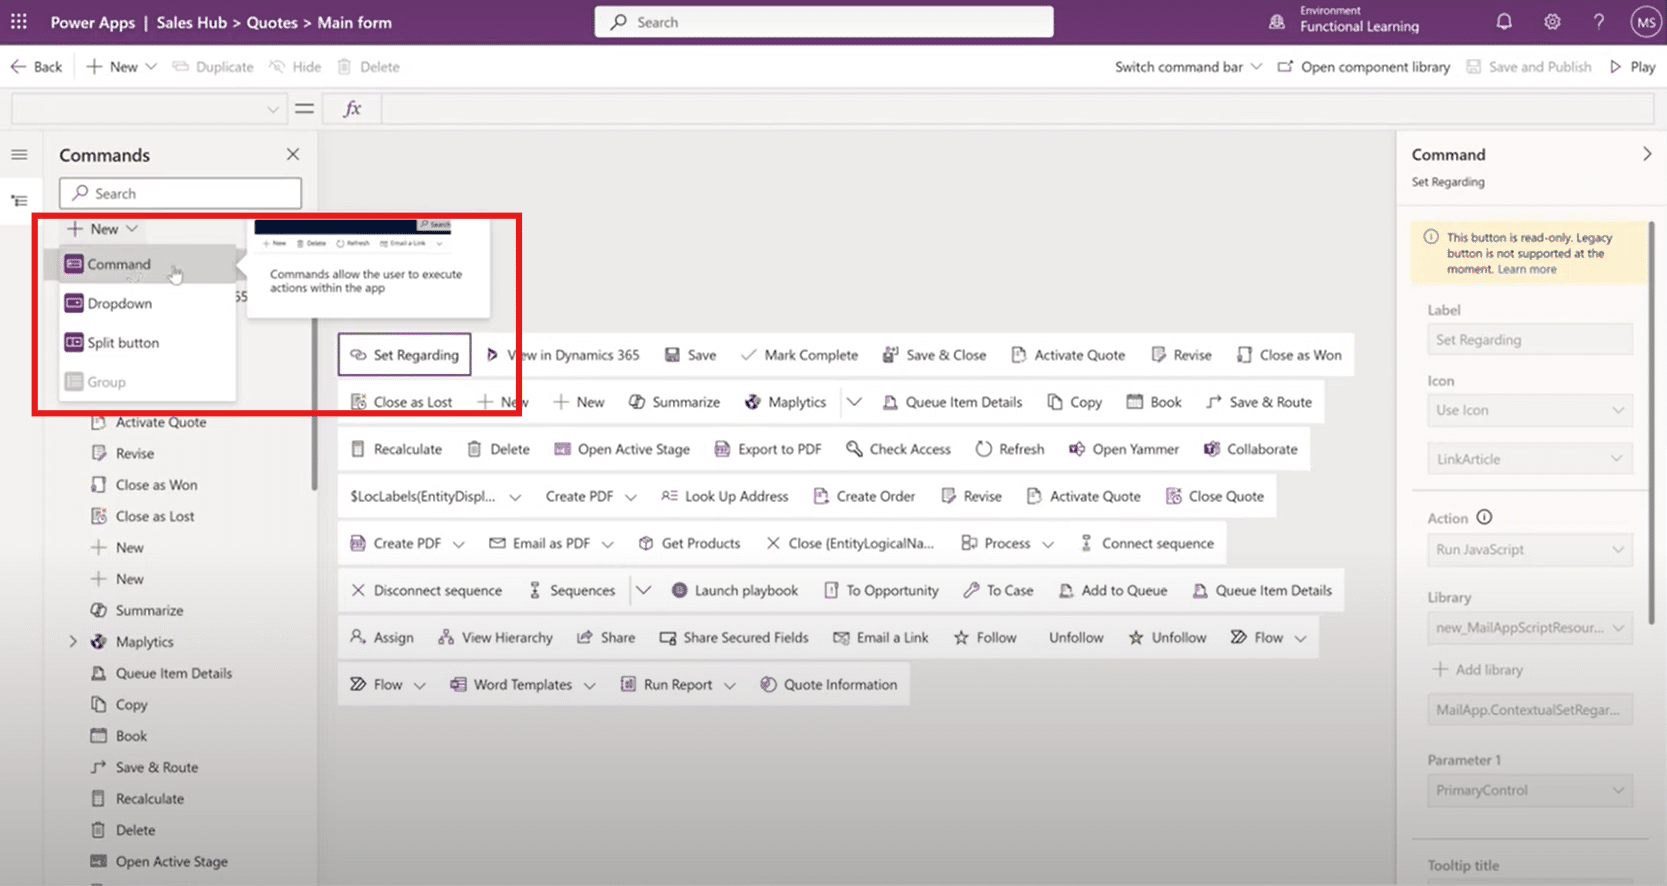
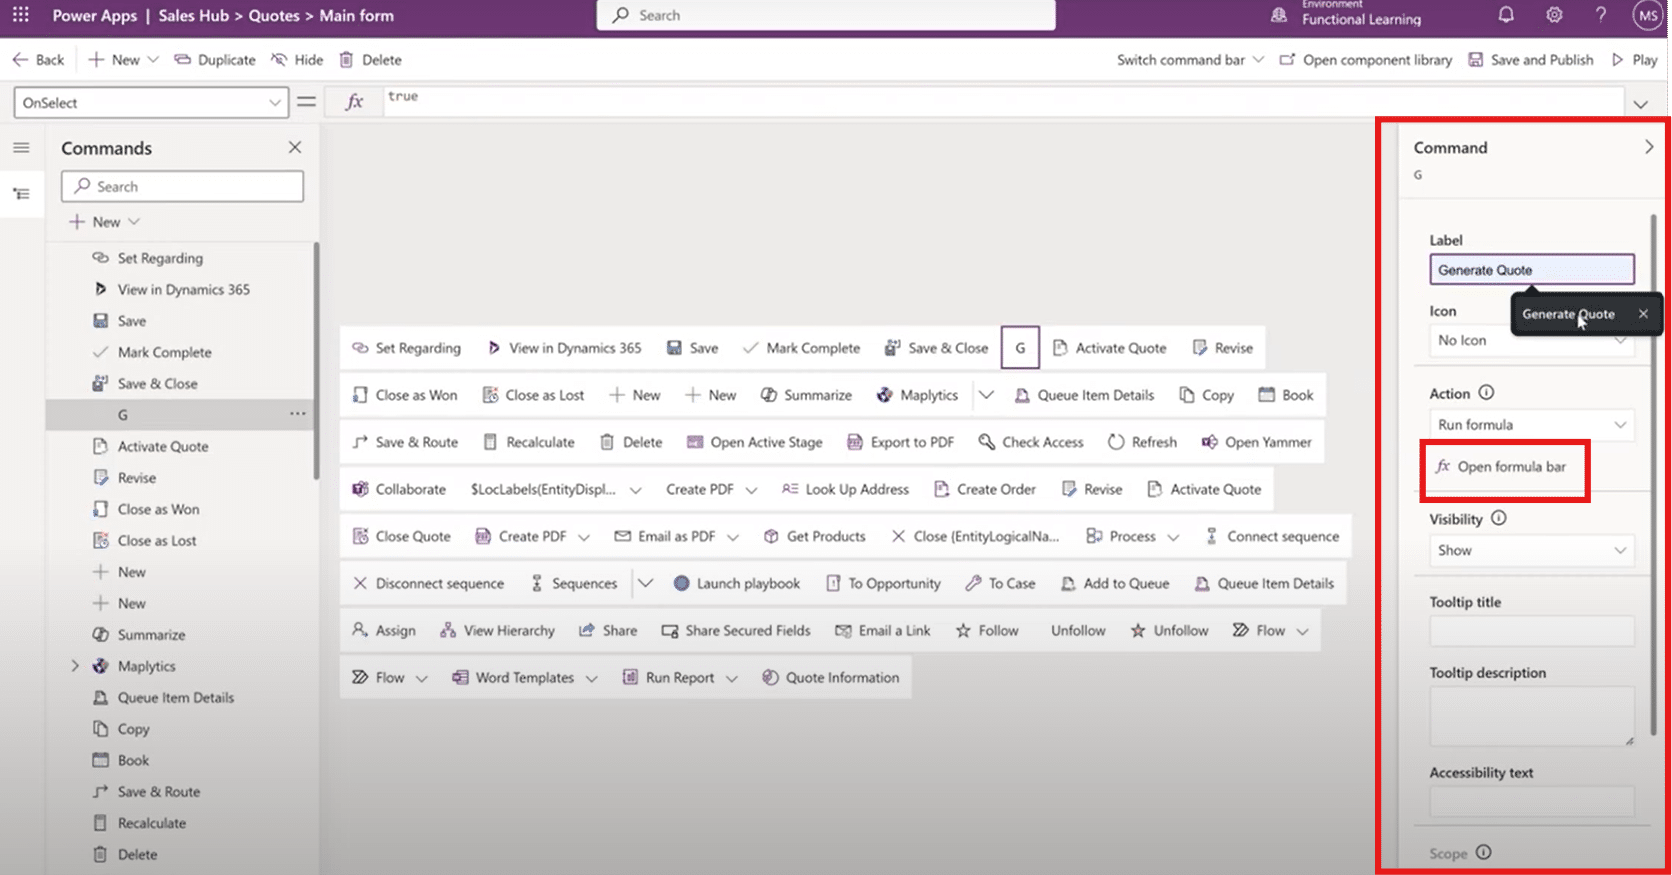
Step 4: Add and Configure the Button
- In the command designer, click + New Command.
- Drag and place the button where you want (e.g., next to the Save button). For this example, we are going to add a "Generate Quote button to the Dynamics 365 Sales hub.
- Configure the button:
- Label: Generate Quote
- Icon: Pick any icon you prefer (like a document or gear)
- Action: Choose Power Fx

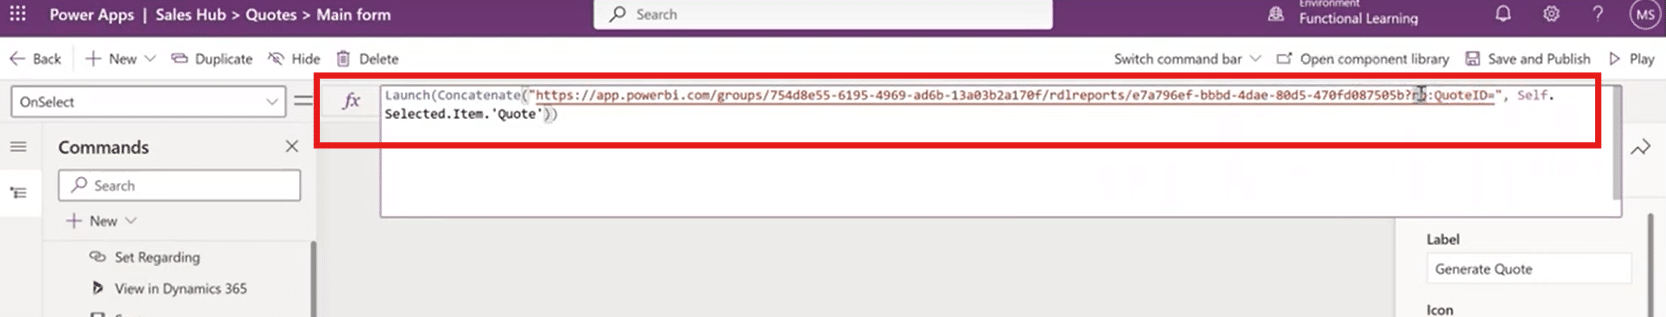
- Click "Open formula bar" on the right hand side and enter this Power Fx formula:
Launch( Concatenate( "https://app.powerbi.com/groups/<workspaceID>/rdlreports/<reportID>?rp:quoteID=", ThisItem.'Quote' ) )- Replace <workspaceID> and <reportID> with the real values from PowerBI.com

- rp:quoteID refers to the "report parameter" and the name of the parameter you created with the paginated report
- ThisItem 'Quote' refers to the current record's ID - Ensure that it matches your field name

- Replace <workspaceID> and <reportID> with the real values from PowerBI.com
- Click Done and then Save and Publish the app
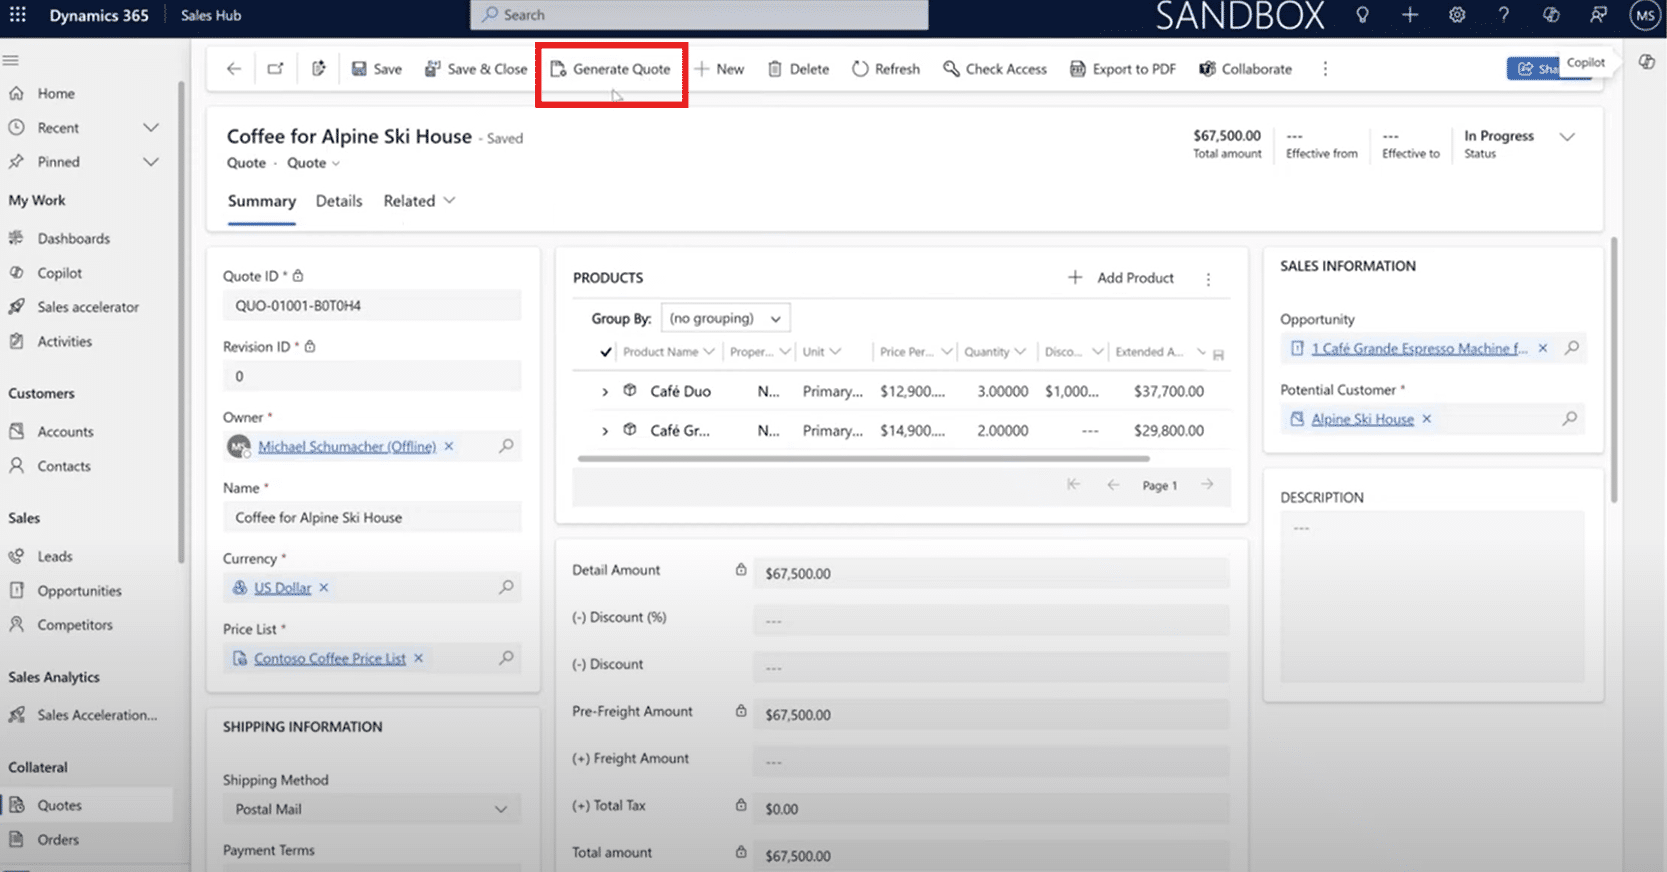
Step 5: Test It in Dynamics CE
- Go to Dynamics 365 Sales Hub.
- Open a Quote record.
- Hit Ctrl + F5 to refresh and ensure your new button appears.
- Click “Generate Quote”.
- A new browser tab will open with the Power BI paginated report, filtered to the current record via the passed quoteID parameter.
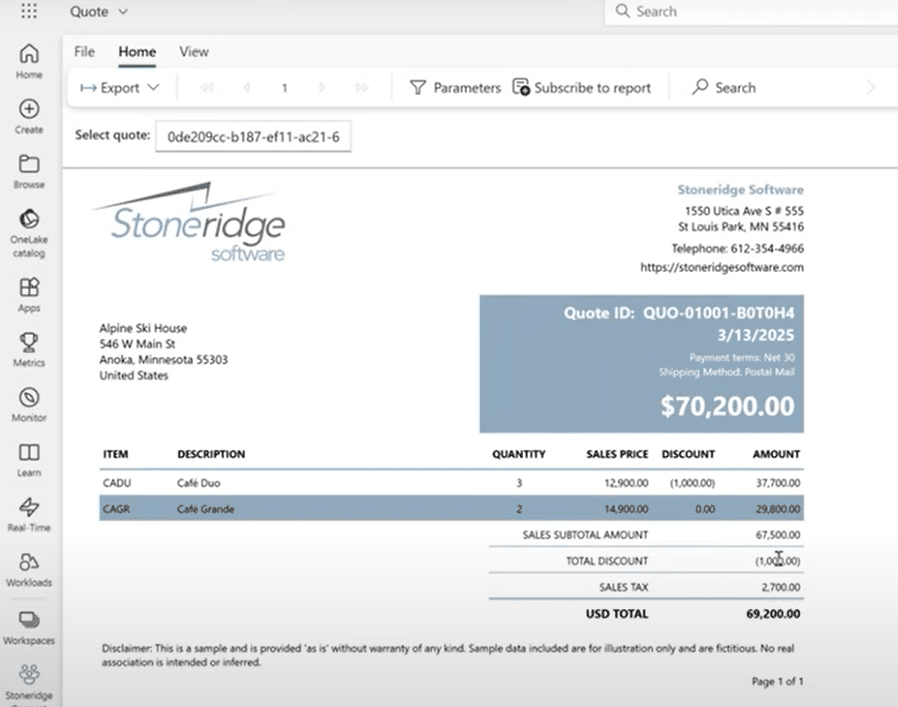
If prompted to sign in, authenticate with the same user that has access to the Power BI workspace.
If you make changes to the quote such as quantities or values, you can hit “Generate Quote” again, and the report will reflect the new information within seconds. This is a real-time, on-demand reporting tool that integrates seamlessly into your workflow, enhancing efficiency.
Here are some additional things you can do with this feature:
- Reports can be exported to PDF, Excel, or Word.
- Parameters passed to the report can be visible or hidden.
- The report uses real-time data from Dataverse—no static exports are needed.
Talk to the Stoneridge Experts to Learn More
Power BI is a tremendously useful tool and integrates seamlessly with your Dynamics 365 solutions. No matter what you want to use it for, the Stoneridge team can help you optimize processes and streamline workflows.
Get in touch with us today to start using Power BI to the fullest extent!

Under the terms of this license, you are authorized to share and redistribute the content across various mediums, subject to adherence to the specified conditions: you must provide proper attribution to Stoneridge as the original creator in a manner that does not imply their endorsement of your use, the material is to be utilized solely for non-commercial purposes, and alterations, modifications, or derivative works based on the original material are strictly prohibited.
Responsibility rests with the licensee to ensure that their use of the material does not violate any other rights.