


Power BI Reporting with Dynamics 365 Customer Engagement
As Microsoft Power Platform’s tools are becoming an insurgence in many businesses, Power BI, the main reporting tool of the Power Platform is also getting used by more companies. This article isn’t about building Power BI reports. There are many existing documents, articles and blogs that discuss getting Power BI running in your business. Rather, this article is about leveraging Power BI Reports, charts, KPI’s and Dashboards into your Dynamics 365 Customer Engagement (CE) application.
What is Power BI?
Power BI is one of the four pillars of Microsoft’s Power Platform (others are Power Apps, Power Automate (formerly known as MS Flow) and Power Virtual Agents). It is the “go-to” platform to deliver data-driven insights into everyone’s hands. Reports, Charts and KPI’s can be created in Power BI from really any database. Of course, there are “out of box” data connectors to use data from Microsoft Products such as Dynamics 365 CE as well as many other Microsoft and non-Microsoft applications. Using these connections, users can build reports, charts and KPI’s using a tool called Power BI Desktop. Once created, they can be published to Power BI, which is a component of Microsoft Office online. Once published, users can be granted access to these reports and charts via their browser or through the Power BI app as part of Office 365. Different reports and charts can be gathered and combined and published on Dashboards for users to help with organization, which is very similar to how you may be creating Dynamics 365 dashboards with different views and charts.
You should know there are different licensing options for Power BI (including a free version) which is explained here: https://docs.microsoft.com/en-us/power-bi/service-admin-licensing-organization
Using Power BI in Dynamics 365 CE
Once you have a Power BI report, chart or dashboard created and published, you can integrate them into Dynamics 365 CE. There are a couple of “easy” ways to do this and a few more complex ways. We will focus on the easy methods that most any user can accomplish.
The easy methods involve Dynamics 365 CE personal dashboards. Dynamics users can create their own personal dashboards and they can choose to include Power BI tiles on their dashboard along with other, standard Dynamics 365 CE charts and views. They can also create an entirely new dashboard and just “hook” it to an existing Power BI Dashboard.
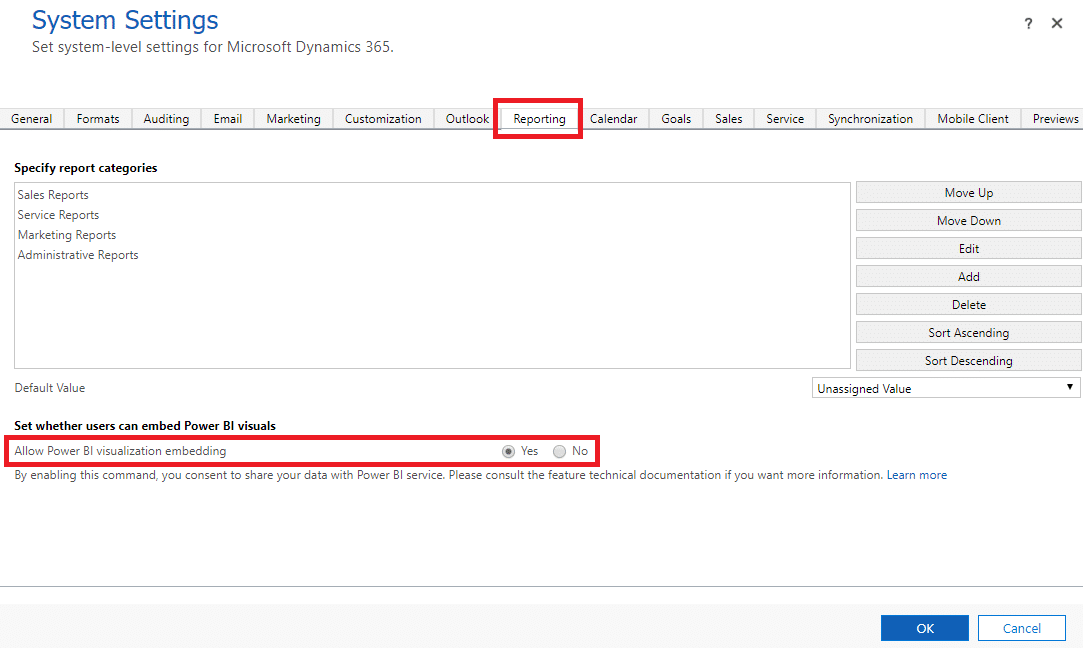
First, you must make sure your Dynamics 365 CE Organization has Power BI Visualizations setting set to “Yes”. This is done under SETTINGS – ADMINISTRATION – SYSTEM SETTINGS
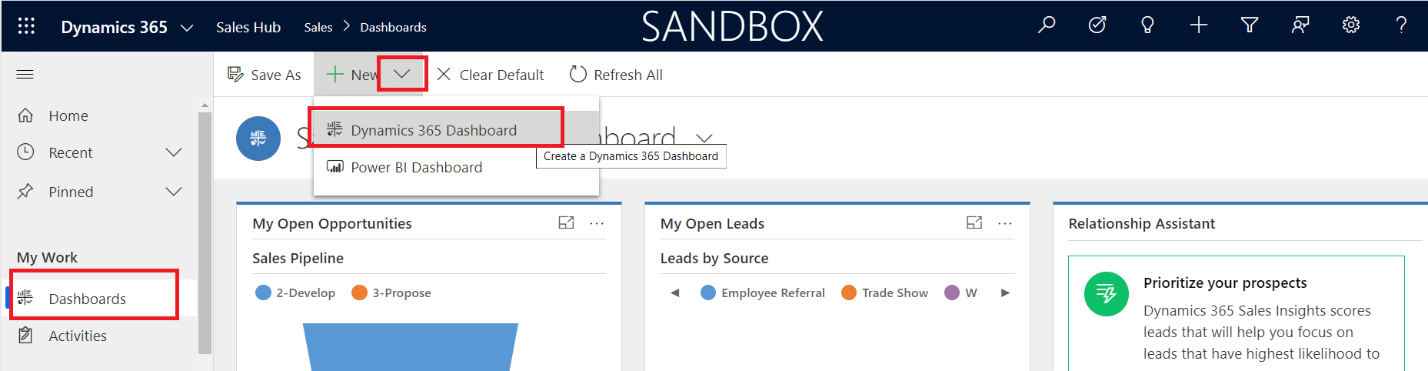
Next, a user can create their own personal dashboard (or edit an existing personal dashboard):
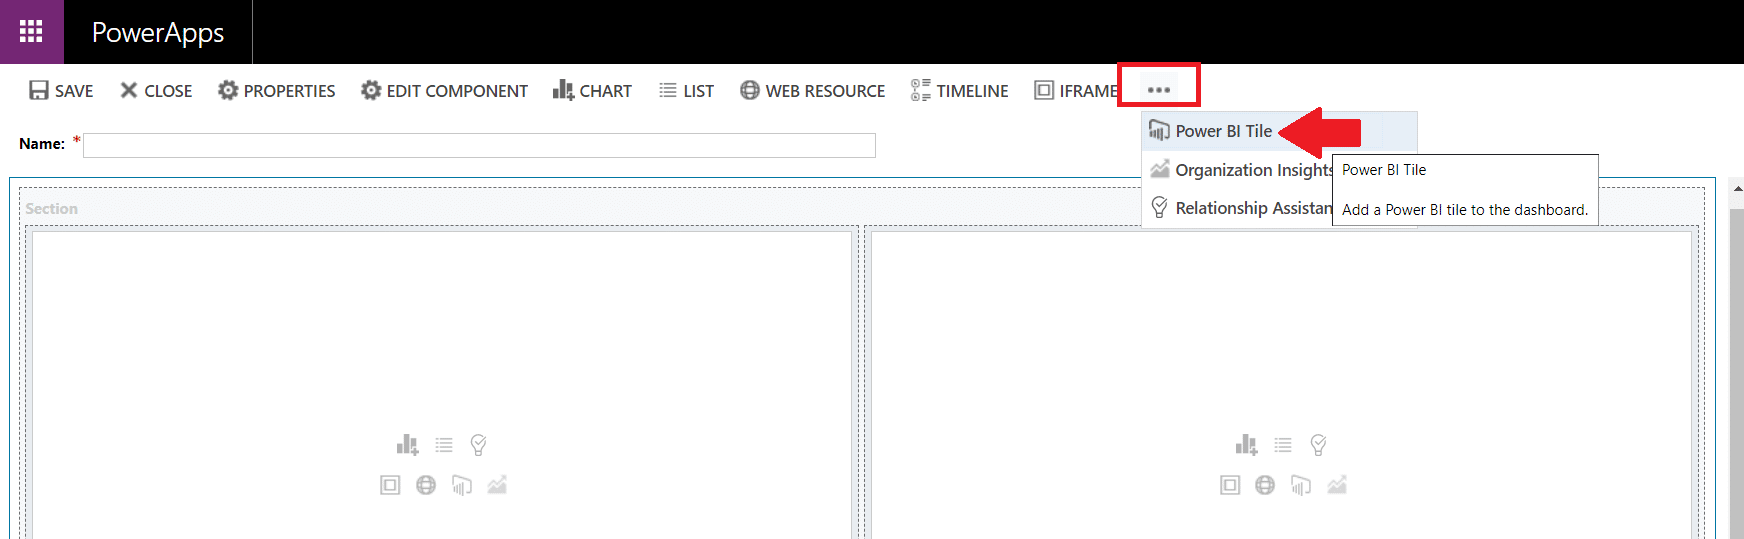
When configuring your personal dashboard, you can add a Power BI Tile:
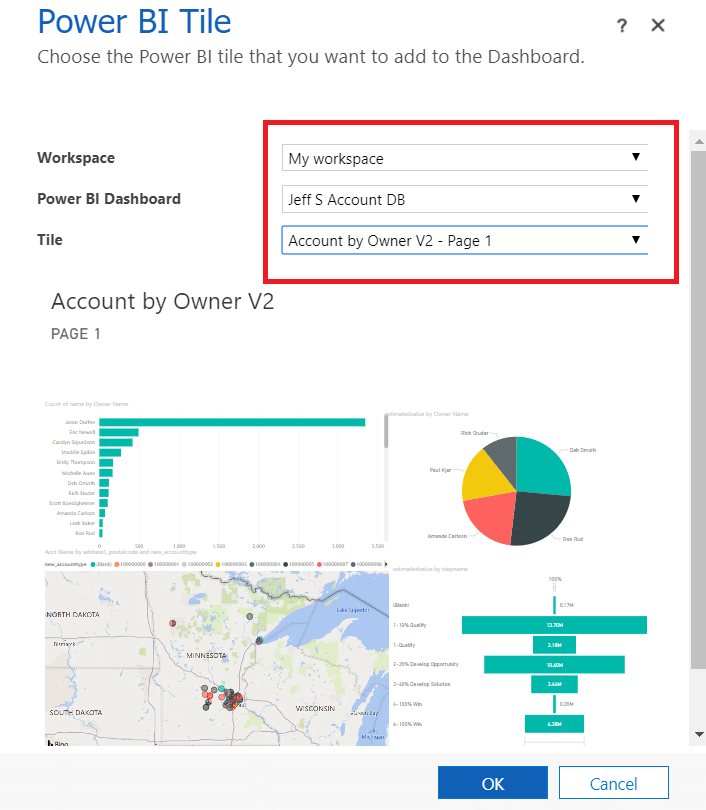
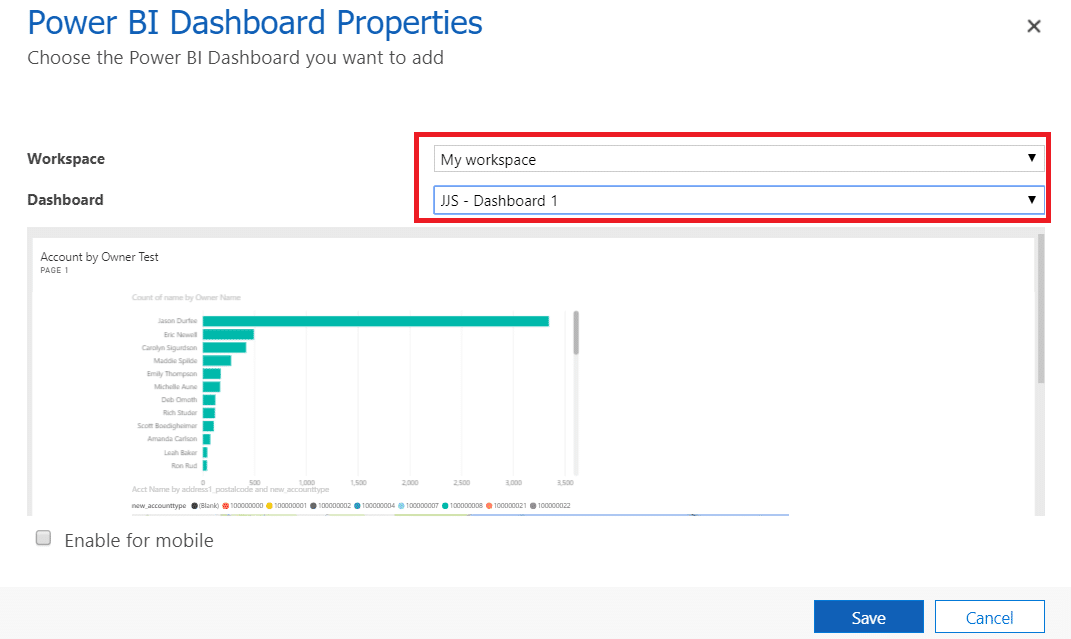
Next, choose the Workspace, Dashboard, and Tile you have created and published in Power BI that you want to be rendered in your Dynamic 365 CE Dashboard tile.
You can also choose to take an entire Power BI Dashboard and make that a Dynamics 365 personal Dashboard:

Users can also just “hook” their personal Dynamics 365 CE Dashboard to an existing Power BI Dashboard.
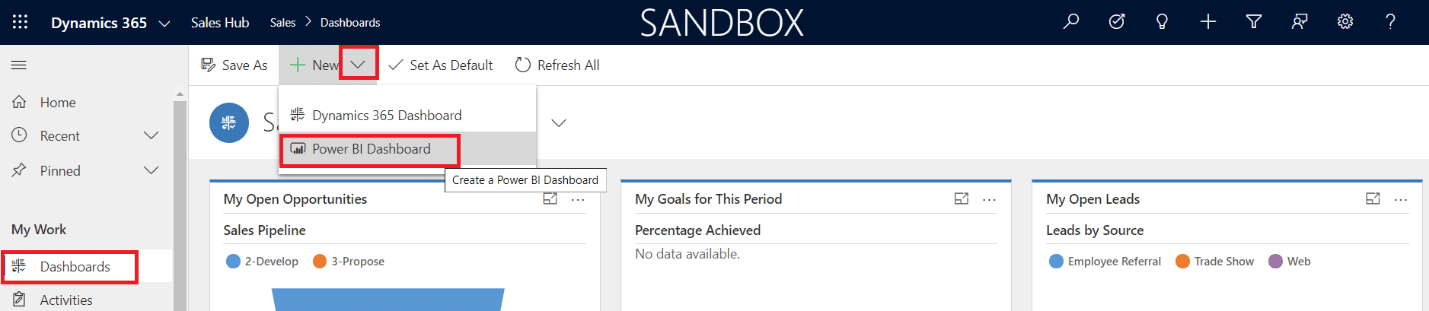
When creating an entire Power BI Dashboard, simply choose the location of your Power BI Dashboard:
Below is an example of a Dynamics 365 personal dashboard with a tile coming from a Power BI report/chart shown alongside existing Dynamics 365 CE charts and views:
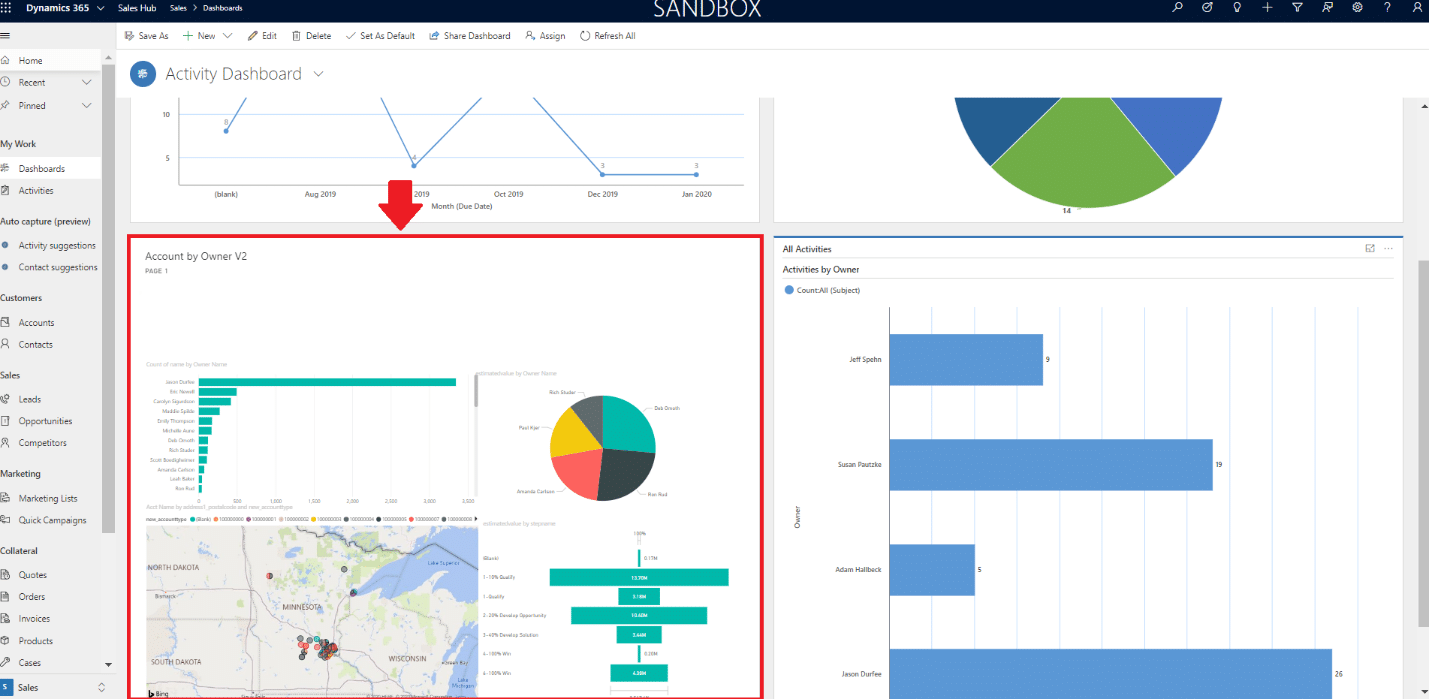
That is it! You now have exposed your creative Power BI objects into your Dynamics 365 Dashboards. Power BI can create complex reports and charts such as the example above where we are plotting potential customers on a map of Minnesota. You can also do heat maps of where your revenue or potential revenue is coming from, etc.
There are other, more complex ways to show your Power BI reports and charts inside of Dynamics 365 CE. For example, you could embed a Power BI object on your Account Form in Dynamics. This would be done using an iFrame or some other method and those charts and reports can obviously be contextual to the Account record you are looking at.
Since the above instructions are simply rendering reports, charts or dashboards you have already created in Power BI, the information contained in these reports can be from other systems. The Power BI objects can also be data combined from multiple systems such as Dynamics 365 CE and your ERP system.
Using the above methods, you can deliver powerful data-driven insights into your Dynamics 365 CE user’s hands with a few easy steps.

Under the terms of this license, you are authorized to share and redistribute the content across various mediums, subject to adherence to the specified conditions: you must provide proper attribution to Stoneridge as the original creator in a manner that does not imply their endorsement of your use, the material is to be utilized solely for non-commercial purposes, and alterations, modifications, or derivative works based on the original material are strictly prohibited.
Responsibility rests with the licensee to ensure that their use of the material does not violate any other rights.