


How to Create Impactful Visuals in Power BI for Dynamics 365 Business Central
Creating compelling, intuitive, and impactful visuals in Power BI for Dynamics 365 Business Central (D365 Business Central) doesn’t happen by accident. It is the intentional result of strategic and thoughtful design.
In this blog, we will explore best practices for building visuals that are not only aesthetic but drive effective reporting, deliver meaningful insights, and empower decision-making processes. From fundamental layout considerations, interactive dashboards, and storytelling to the performance reliability of your visuals, we will shed light on a variety of techniques that will elevate the user's experience and enhance your overall narrative.
How to Publish Engaging and Dynamics Power BI Visuals in Dynamics 365 Business Central
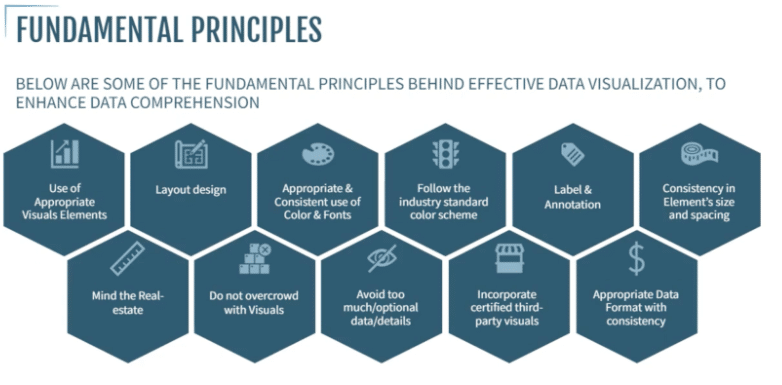
One of the easiest first steps to take to enhance your visuals is to begin incorporating a variety of fundamental principles that will collectively contribute to an effective data visualization in Power BI. Below are some of the top tried and true practices that will foster clarity, consistency, and help ensure more impactful reporting.
- Use of Appropriate Visual Elements: Ensure you use suitable visual elements in Power BI to avoid confusion and effectively convey the intended message. Weigh the strategic choices such as donut charts, pie charts, and bar graphs and consider how they may each display the information and which would be most effective.
- Layout Design: Take time initially to plan your layout design. Even if you sketch it out in a notebook, the thoughtful arrangement of visuals will enhance the overall appeal and user experience.
- Color and Font Consistency: It is important to maintain consistent and appropriate use of colors and fonts throughout all your visuals in a report or presentation. It is best to either adhere to Power BI defaults or align with industry standards for a polished and professional look.
- Follow Industry Standard Color Schemes: Use industry-standard color schemes when appropriate, leveraging universally recognized color associations to convey specific meanings, such as red for errors or warnings.
- Proper Labeling and Annotation: Properly label and annotate visuals and data elements within reports. This will ensure clarity and coherence across multi-page reports with consistent formatting.
- Consistency in Sizing and Spacing: Use consistent sizing and spacing of visual elements throughout the entire report, this increases the impact of professionalism and it instills confidence in the information being presented.
- Mindful Real Estate Management: It is important to consider your real estate constraints. If it is necessary, adjust the element sizes based on available space while maintaining readability for an optimal user experience.
- Avoid Overcrowding: Do not overcrowd a page with visuals. Prioritize essential data visuals and maintain a clean, effective report.
- Avoid Inclusion of Optional Data: Include only essential data details based on your audience's needs and decision-making requirements. Avoid adding optional details that may distract from the core insights.
- Use Certified, Third-Party Visuals: It is highly recommended to use certified third-party visuals in Power BI. This will ensure the reliability and useability of the data in the long run, especially considering potential deregistration or removal of uncertified add-ins.
- Consistent Data Format: Ensure that all your data formatting is consistent. This includes using a standard format for dates and decimals throughout your reports for clarity and coherence.
Make Your Power BI Dashboard Easy to Use
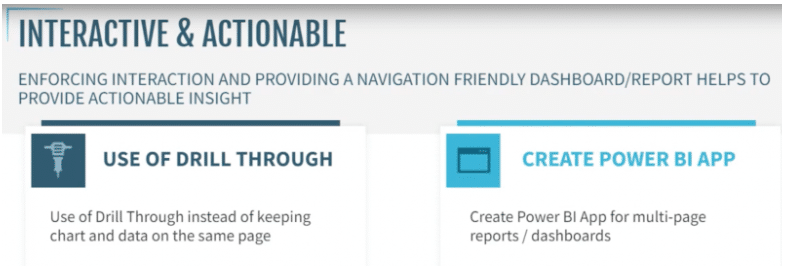
In addition to incorporating the fundamental principles outlined above, it is important to infuse interactivity and actionability throughout your Power BI reports to elevate user engagement and decision-making. Consider these two approaches to provide a friendly navigation dashboard and actionable insights.
- Leverage Drill Throughs: Harness the power of drill throughs, a standout feature in Power BI, enabling users to delve directly into the data source or table behind a visual, providing a deeper, more insightful experience.
- Create a Power BI App: Enhance the user experience for multi-page reports, through creating a Power BI app. This simple yet effective practice transforms the report into an interactive application-like interface, providing users with a more engaging and app-like feel rather than a traditional report.
A Note of Caution: Although the strategic use of bookmarks is common and a dynamic way to navigate through your report, exercise caution and avoid overuse, to prevent potential errors and ensure a seamless user experience. Try the two suggestions above for alternative options.
Use Power BI Visualizations in Dynamics 365 Business Central to Tell Stories of Success
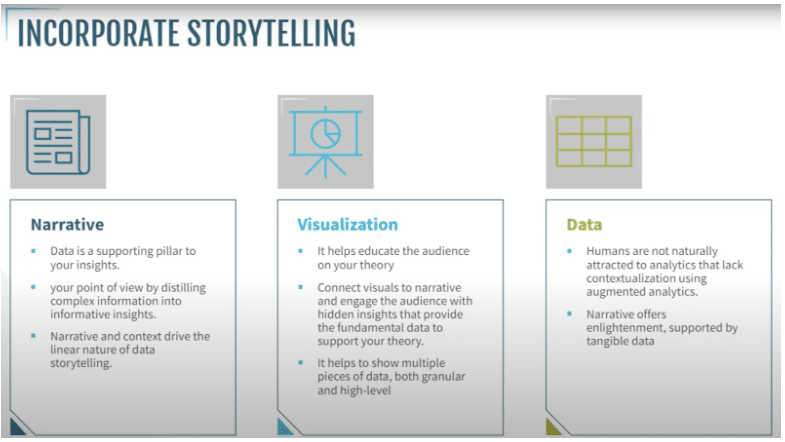
It’s also imperative to incorporate storytelling into your data presentations as a powerful way to convey narratives through visualizations backed by data. By integrating storytelling principles into Power BI, you can captivate your audience and effectively communicate complex narratives through impactful visual representations. Here are a few examples of how storytelling could be incorporated into your visuals with ease:
- Create a Headline: A dashboard may provide data, but you can build a stronger story by simply providing an intro sentence or headline above a data-driven graphic. This is a quick, yet effective, way to direct the narrative and the overarching message you want to present.
- Use graphics together: Presenting a series of graphics together is a strategy that can be used to tell a larger story.
- Leverage Infographics: Using infographics is a compelling and quick way to tell a visually appealing data story.

When delving into the realm of performance optimization for your Power BI visuals, it's essential to strike a balance between functionality and efficiency. From thoughtful use of bookmarks and slicers to crafting a robust data model, these considerations play a pivotal role in ensuring a smooth and responsive user experience.
More Tips and Tricks to Strengthen the Connection Between Power BI and Dynamics 365 Business Central
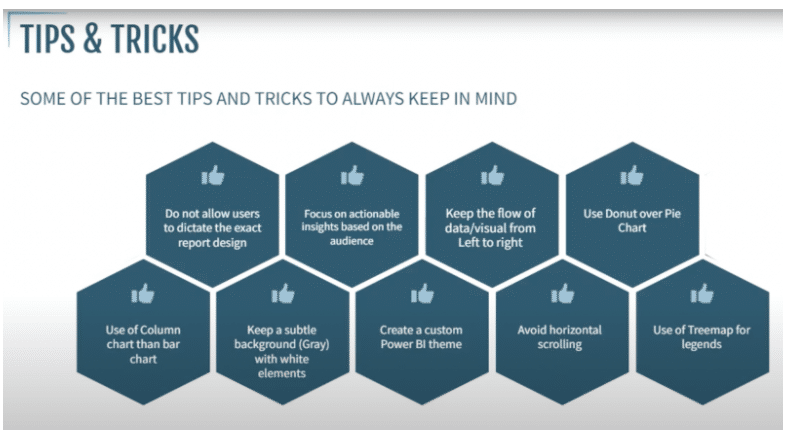
Lastly, here are some of our favorite tips and tricks to keep in mind as you build your Power BI dashboards and elevate your visuals to increase their impact and effectiveness.
- Avoid User-Dictated Designs: Try to avoid letting your audience dictate the exact report design. Instead, focus on understanding the objectives and decisions they seek from the data and then use your design expertise to build out the visuals while also meeting their needs.
- Tailor to Audience Needs: Recognize your audience's level and purpose for using the data, then ensure actionable insights that align with their specific requirements and preferences.
- Optimize Data Flow: Arrange your data and visuals from left to right, emphasizing important information on the left side to enhance readability and cognitive flow.
- Choose Donut Over Pie Charts: Opt for donut charts over pie charts for improved performance in data visualization.
- Column Charts Bar Charts: Consider using column charts first, then bar charts in your design for effective data representation.
- Utilize Subtle Backgrounds: Use simple, one-color backgrounds. For example, use a gray background with white elements to create a visually appealing and focused report.
- Create Custom Power BI Themes: Creatively, develop custom themes for consistent color schemes, font styles, and chart designs across multiple reports within an organization for a polished look.
- Avoid Horizontal Scrolling: Minimize or eliminate horizontal scrolling in your visuals to enhance user experience and interaction with the report.
- Utilize Treemaps for Legends: Employ treemaps for legends when dealing with similar legends across multiple visuals to improve performance and visualization consistency.
As you embark on your journey of creating visuals, keep these insights in mind and your reports will not only look visually appealing but also play a vital role in facilitating informed decision-making processes.
For more information on building effective visuals in Power BI for D365 Business Central, check out this informative video featuring Manu Rau Patel, a senior consultant at Stoneridge Software.
{
"@context": "http://schema.org",
"@type": "VideoObject",
"name": "Best Practices for Creating Visualizations in Power BI for D365 Business Central",
"description": "",
"thumbnailUrl": "https://i.ytimg.com/vi/youP6RA2zec/default.jpg",
"uploadDate": "2023-11-29T15:51:29Z",
"duration": "PT29M48S",
"embedUrl": "https://www.youtube.com/embed/youP6RA2zec",
"interactionCount": "16"
}
Wondering How to Use Power BI in Dynamics 365 Business Central?
Stoneridge can help you set up Power BI and use it to strengthen and optimize your business processes. To learn more about partnering with Stoneridge, contact us today.

Under the terms of this license, you are authorized to share and redistribute the content across various mediums, subject to adherence to the specified conditions: you must provide proper attribution to Stoneridge as the original creator in a manner that does not imply their endorsement of your use, the material is to be utilized solely for non-commercial purposes, and alterations, modifications, or derivative works based on the original material are strictly prohibited.
Responsibility rests with the licensee to ensure that their use of the material does not violate any other rights.