


Turn Data into Decisions with Dynamics 365 BPA, Microsoft Fabric, and Power BI
As we continue into 2026, one thing is clear for manufacturers and mid-market organizations running on Microsoft Dynamics 365: data, while still important, is no longer the differentiator. What matters now is how quickly and confidently you can turn that data into smart business decisions.
In this blog, we’ll walk through exactly how Microsoft’s ecosystem—specifically Dynamics 365, Business Performance Analytics (BPA), Power BI, and Microsoft Fabric—is evolving to support more intelligent, insight-driven organizations.
Watch the video or keep reading.
We’ll start by grounding the conversation in what “data” means, then explore how Dynamics 365 BPA and Power BI work together and finally walk step by step through the BPA demo that shows how quickly value can be unlocked right out of the box.
Defining Data: From Raw Numbers to Business Wisdom
Inside most organizations, the word “data” means very different things to different people. For some, it’s rows and columns in a database. For others, it’s reports, KPIs, or dashboards. This disconnect is often the root cause of stalled analytics initiatives—not a lack of technology, but a lack of shared understanding and different departments not being on the same page.
The DIKW Pyramid: A Useful Mental Model
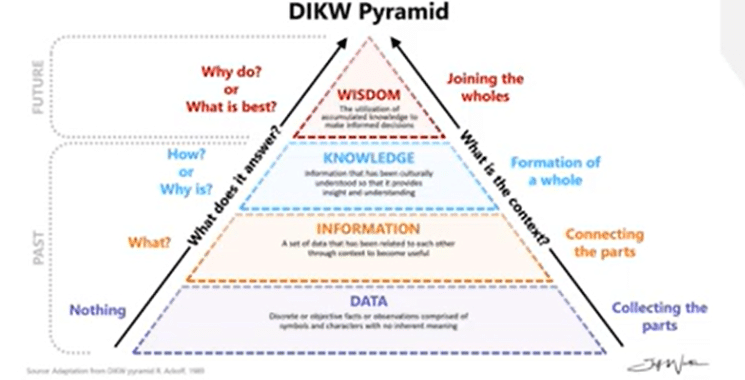
To frame the conversation, let’s look at the DIKW pyramid, a long-standing concept used to classify how organizations extract value from data:
- Data – Raw, discrete data points collected from systems
- Information – Related data organized into reports
- Knowledge – Insights that explain how and why things happen
- Wisdom – Informed decision-making that drives the business forward
Most ERP systems, including Dynamics 365, excel at generating data and information. You can run an AR aging report. You can view inventory balances. You can see historical financial performance. But those outputs alone don’t necessarily tell you why something is happening—or what you should do next.
The real opportunity lies in moving beyond “What happened” and into “Why did it happen” and “What should we do about it.” That shift—from information to knowledge and wisdom—is where modern analytics tools come into play and how you can truly drive your business forward with data-driven decision-making.
Analytics Maturity: Another Lens on the Same Problem
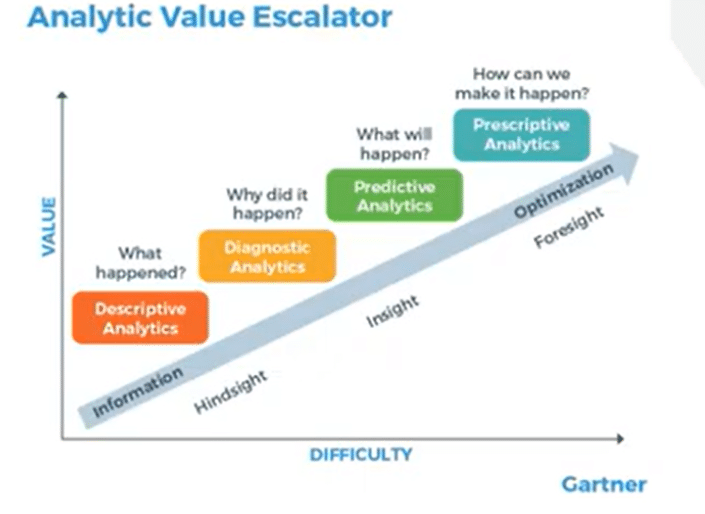
Similar to data, every company out there today will say they have analytics. However, bridging the gap between having analytics and understanding what they mean and how they factor into decision-making are two separate things. I like to use Gartner’s Analytic Value Escalator to analyze the effectiveness of client analytics. This includes:
- Descriptive – What happened?
- Diagnostic – Why did it happen?
- Predictive – What is likely to happen next based on the information you have?
- Prescriptive – What should we do about it?
While many organizations operate comfortably at the descriptive level with standard reports and historical views, fewer leap into predictive or prescriptive analytics, which allows them to harness data as a strategic asset truly. Having that willingness to move to the next step in data management is important because tools like Dynamics 365 BPA, Power BI, and Microsoft Fabric are not standard reporting tools. They allow you to advance analytics maturity without rebuilding your entire data strategy from scratch.
Business Process Automation, Microsoft Fabric, Power BI
With your foundation set and equipped with a strong sense of how data functions has changed in today’s world, let’s look at some of the Microsoft tools that can help you drive smart decision-making.
Power BI: Best-in-Class Visualization
Power BI need’s little introduction, as it has become Microsoft’s flagship analytics and data visualization platform that lets you create interactive, engaging, and dynamic dashboards that give you and your team thorough insights into data that matters.
With Power BI, you can:
- Connect to D365 data via connectors, APIs, or Dataverse
- Deliver rich, interactive visualizations that are easy to analyze
- Support highly customized reporting and modelling
Power BI excels when organizations want flexibility and advanced analytics capabilities that allow you to dig into your data at a deeper level.
Fabric: The End-to-End Data Platform
Fabric represents Microsoft’s newer, all-in-one SaaS data platform, designed to unify data engineering, data warehousing, analytics, and AI. It is one of Microsoft’s fastest-growing products in history and is very easy to use.
Some key features of Fabric include:
- Deep integration with Azure data services
- Native alignment with Power BI
- Support for advanced data warehousing patterns
- Built-in AI capabilities
You can also easily set up a sync between Dynamics 365 ERP tools and Fabric that allows for real-time data flow between the two tools with minimal configuration. Fabric is a powerful, scalable, and future-ready tool that weaves relatively seamlessly with Power and D365 to take your data and analytics to the next level.
Enter Business Performance Analytics (BPA)
Business Performance Analytics is a platform that is built right into Dynamics 365 Finance. BPA acts as an accelerator, helping your organization move from raw ERP data to structured, business-ready analytics without standing up a separate data warehouse. Some key information you should know about BPA includes is it:
- Has unified and scalable data models that simplify going from data to knowledge
- Requires no additional licensing beyond D365 Finance
- Includes 15 pre-built reports out of the box
- Empowers you with the ability to build on top of pre-built reports or create your own
- Provides a pre-modelled fact and dimension data model
- Integrates directly with Power BI
BPA is particularly compelling for organizations that want faster insights with minimal setup, while still preserving a path to more advanced analytics in the future.
Setting Up and Using BPA in Dynamics 365
Let’s get into the meat and potatoes of this topic and show you how you can start using BPA in Dynamics 365, Fabric, and Power BI to reach new heights when it comes to analyzing and using your data.
Prerequisites and Setup
Before accessing BPA, a few prerequisites must be met:
- Dynamics 365 Finance version 10.0.38 or later
- A Tier 2 or higher environment (sandbox or production)
- Appropriate administrator permissions
If you are wary of long or potentially confusing setup cycles, Microsoft’s installation documentation gives you a clear and straightforward picture of how you can get this done. You can also always reach out to the Stoneridge team, as we can help you set up and optimize these tools.
Accessing BPA
Once installed, BPA appears as its own application within the Microsoft business apps ecosystem. Follow these steps to access it:
- Open the Microsoft app launcher (the nine-dot grid)
- Navigate to Business Applications
- Select Business Performance Analytics
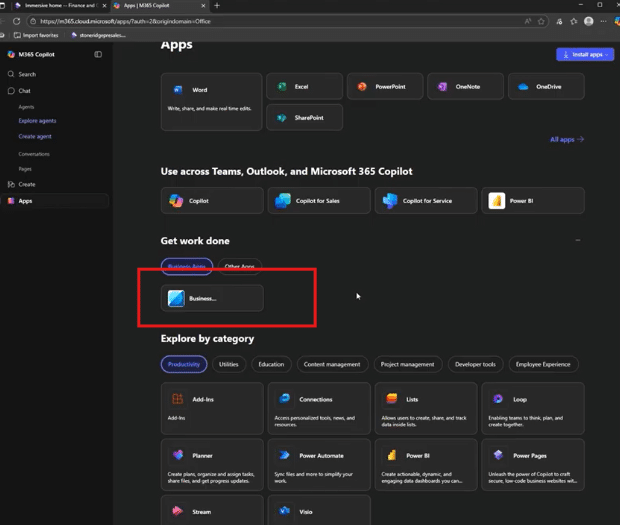
This launches the BPA workspace, separate from the core Finance and Operations interface but fully connected to it.
Out-of-the-Box Reports
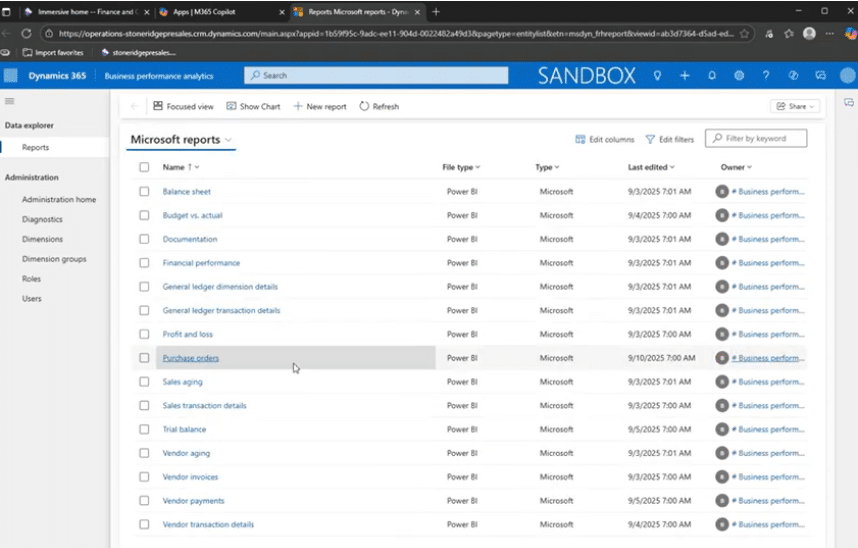
Once you install BPA, you can access 15 Microsoft reports that are pre-configured and programmed into the workspace. These reports cover common financial and operational use cases, including:
- Financial performance (budget vs. actual)
- Vendor aging
- Customer aging
- Profit and loss insights
- Sales transactions
- Budget vs Actual
- And more
Even without a perfect data volume, these reports are usable right away and provide you with a clear starting point for analysis.
Example 1: Exploring Financial Performance
Let’s take a look at the Financial Performance report as an example of how this tool can help you. When you click into this report, you will see that it includes:
- Waterfall visualizations for revenue, expenses, and P&L
- Budget-to-actual comparisons
- Multi-currency support
- Filtering by legal entity, accounting date, and more
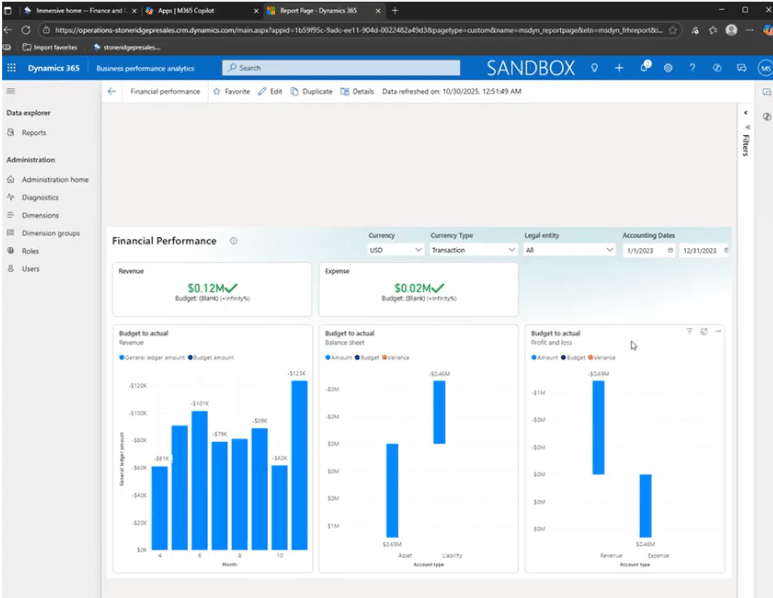
Because these reports are built in Power BI, users can interact with them by dynamically adjusting filters, switching views, and drilling into details without leaving the interface.
Example 2: Vendor Aging and Drill-Down Capabilities
The vendor aging report demonstrated BPA’s ability to move beyond static reporting:
- Aging buckets update dynamically based on selected dates
- Users can filter by vendor accounts
- Drill-down functionality allows navigation from balances to individual invoices and vouchers
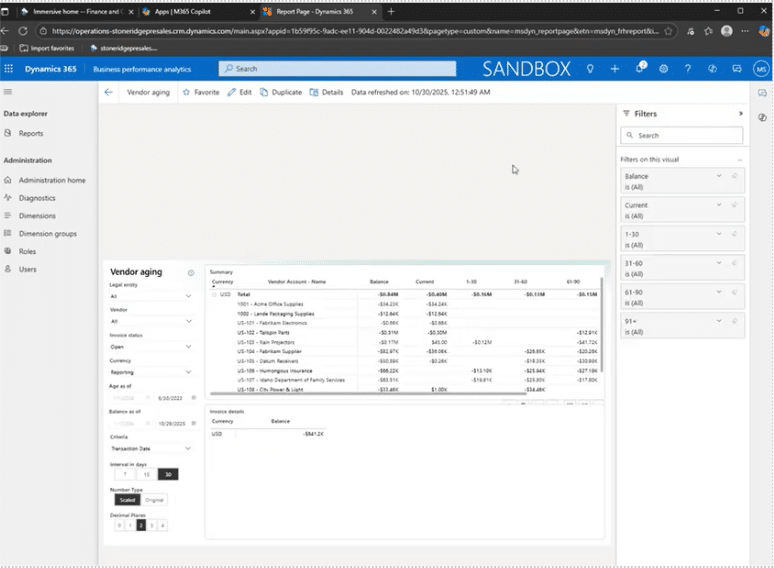
This type of interaction is critical for moving from information to knowledge—understanding not just what balances exist, but where they come from.
Customizing Reports in Power BI
One of BPA’s strongest features is extensibility and customization. From any report, you can click on the Edit button in the top navigation ribbon. This feature:
- Creates a copy of the report (protecting the original)
- Opens full Power BI editing capabilities
- Allows changes to visuals, formatting, filters, calculations, and more
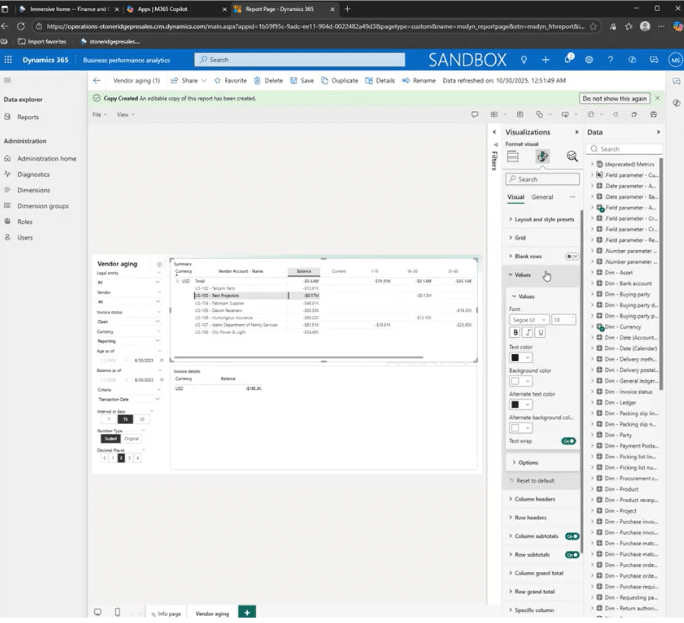
Organizations with in-house Power BI expertise can treat BPA reports as a foundation—customizing them just as they would any other Power BI report, but with the benefit of a pre-built data model.
The kicker? You can harness these Power BI capabilities directly in BPA without having to worry about switching apps or being held up by security concerns. All of your licensing infrastructure, role-based access, legal entity security, and custom security roles all carry through from D365, meaning you and your team can work effectively without having to worry about setting up new rules or security measures or team members accidentally accessing data they shouldn’t.
Data Model and Extensibility
Behind the scenes, BPA provides a clean fact-and-dimension data model—something that typically requires significant effort to design manually. This means:
- Existing facts and dimensions can be extended
- Custom fields, tables, and ISV data can be incorporated
- External data sources can be brought into the model
This extensibility allows BPA to grow with your organization, rather than becoming a dead-end solution.
Exporting to Excel
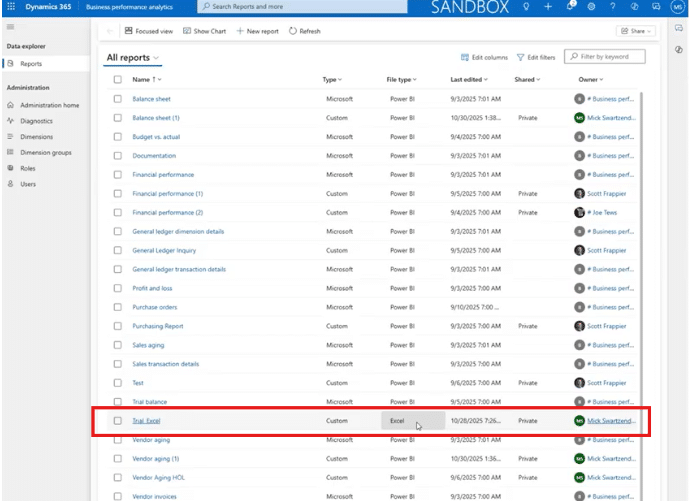
While Power BI and BPA are extremely powerful and more “state of the art” tools, many people still prefer to work with data in Excel, and BPA does not disappoint. You can export reports from BPA to Excel with underlying data models completely intact, enabling:
- Power Pivot analysis
- Custom formulas and calculations
- Continued use of familiar Excel workflows
Excel is still an extremely effective tool for working with and analyzing data. It is also a tool that many people are used to and prefer to work with. The best part of this is that the changes you make in Excel will be automatically updated within BPA, or you can re-import the data. Bridging the gap between modern BI tools and traditional applications allows your team to work where they are comfortable.
Refresh Rates
Currently, BPA data refreshes twice daily—at noon and midnight Pacific time. However, Microsoft plans to align BPA refresh rates with Fabric’s 5–15 minute sync cadence soon.
When that happens, BPA’s value will spike significantly, especially given its lack of additional licensing costs.
Linking BPA to Microsoft Fabric
The last point we want to highlight with this tool is how BPA’s curated data model can be exported directly into Fabric by following these steps:
- On the right-hand navigation menu, go to Administration home
- Click on the Manage button in the Link with Microsoft Fabric box

- Click on Link Fabric at the top
- Paste your link into the pop-up box, then click Link

- Export the fact and dimension model
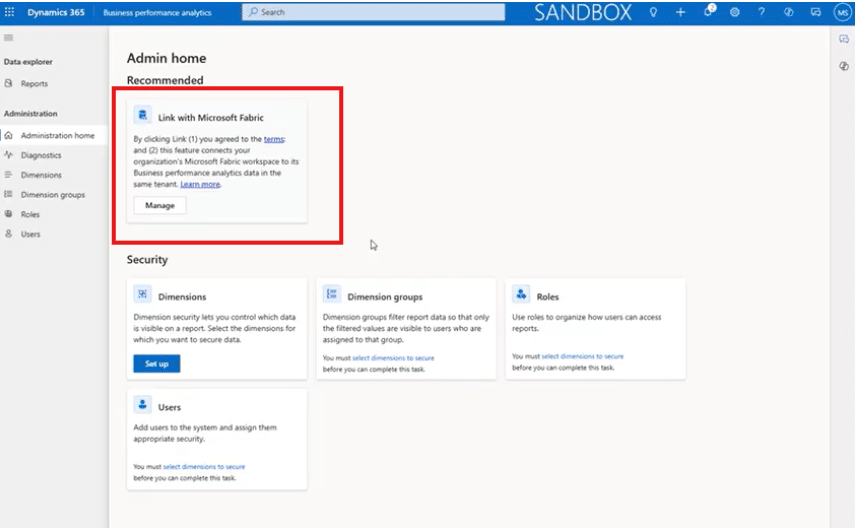
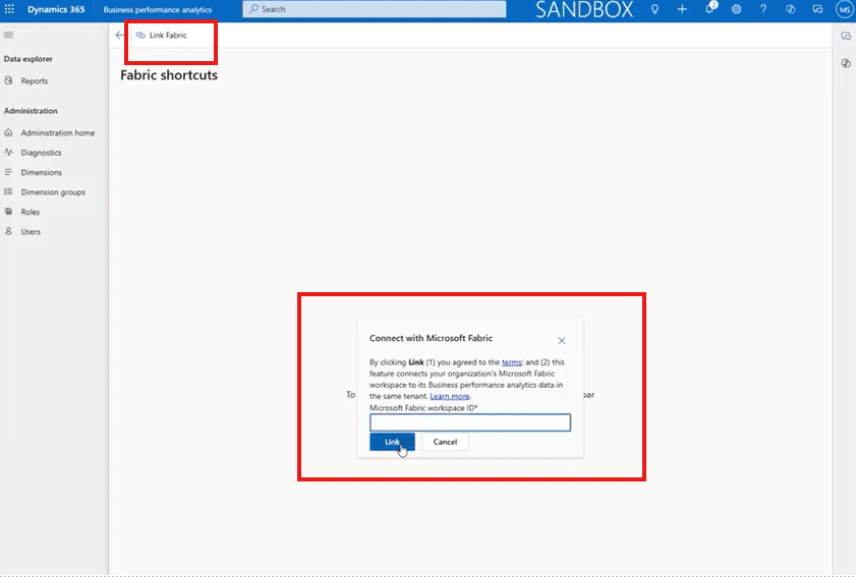
This avoids the complexity of working with raw D365 tables and provides a clean starting point for advanced analytics inside Fabric.
Choosing the Right Path Forward
Simply put, these tools give you a strong, comprehensive and smart data analysis strategy. When you have a solid foundation to work off of, making smart decisions becomes much easier. Here are some final thoughts:
- Fabric + Power BI offer unmatched flexibility and scalability but require more effort and licensing investment. They are also:
- Low to medium effort to get going
- Able to handle highly complex workloads
- A strong way to centralize your data
- AI-ready in every facet
- Business Performance Analytics delivers fast, low-effort insights with business-ready data models at no additional cost. It also:
- Contains simple workloads with an out-of-the-box, user friendly data model
- Can only be used inside of D365 – but can still bring in external data
- Is included in the cost of your D365 Finance license
For many organizations, BPA represents an ideal starting point—a way to move quickly from data to insight, while laying the groundwork for more advanced analytics when the time is right.
Talk to the Stoneridge Team to Get Started!
If you are ready to properly harness your data and completely level up your analysis and decision-making processes, talk to the experts at Stoneridge today!
Our team can help you set this tool up and optimize it so that it suits your specific business needs and drives you towards sustained success.

Under the terms of this license, you are authorized to share and redistribute the content across various mediums, subject to adherence to the specified conditions: you must provide proper attribution to Stoneridge as the original creator in a manner that does not imply their endorsement of your use, the material is to be utilized solely for non-commercial purposes, and alterations, modifications, or derivative works based on the original material are strictly prohibited.
Responsibility rests with the licensee to ensure that their use of the material does not violate any other rights.