


Using Excel for Interactive Reporting with Dynamics AX 2012 Data
There are many ways to get data into Microsoft Excel from Dynamics AX 2012 for reporting purposes. The purpose of this article is to demonstrate quickly what you can do within Excel AFTER the data is in Excel.
The request
For our purposes, let’s assume that a request has come in to see the distribution of our customers across the country. This must be a very visual report that quickly shows this information with virtually no analysis by the end user. It has been decided that a heat map may be the best way to show this information.
SQL Server Reporting Services can be used to create a heat map report. However, by using the Power View functionality that comes with Office 2013 (and Office 2016), this can be quickly created, AND as an added bonus allow the user to interact with the report.
Step 1. Get the data into Excel
This can be done in many ways. For purposes of this demo, a job has been created to read the customer account, zip code, and country and insert that into Excel. Here is the job:
static void HeatMapDemoJob(Args _args)
{
    // Excel object definitions
    SysExcelApplication     xlsApplication;
    SysExcelWorkBooks       xlsWorkBookCollection;
    SysExcelWorkBook        xlsWorkBook;
    SysExcelWorkSheets      xlsWorkSheetCollection;
    SysExcelWorkSheet       xlsWorkSheet;

    // random variable declarations
    int                     row = 2;

    CustTable               custTable;

     // define and initialize the progress bar so the user knows what is going on
    SysOperationProgress progress = new SysOperationProgress();
    #AviFiles

    Progress.setAnimation(#aviTransfer);
    progress.setCaption("Sending information to Excel");
    progress.setText("Processing...");
    progress.update(true);

    //Initialize Excel instance
    xlsApplication           = SysExcelApplication::construct();

    //Create Excel WorkBook and WorkSheet
    xlsWorkBookCollection    = xlsApplication.workbooks();
    xlsWorkBook              = xlsWorkBookCollection.add();
    xlsWorkSheetCollection   = xlsWorkBook.worksheets();
    xlsWorkSheet             = xlsWorkSheetCollection.itemFromNum(1);

    //Excel columns captions

    // columns should autofit
    xlsWorkSheet.columns().autoFit();

    // headings
    xlsWorkSheet.cells().item(row,1).value("Customer account");
    xlsWorkSheet.cells().item(row,2).value("Postal code");
    xlsWorkSheet.cells().item(row,3).value("Country");

    row++;

    //Fill Excel with dataTable info
    while select custTable
    {
        progress.setText(strFmt("Transferring customer %1",custTable.AccountNum));
        xlsWorkSheet.cells().item(row,1).comObject().numberFormat('@');
        xlsWorkSheet.cells().item(row,1).value(custTable.AccountNum);
        xlsWorkSheet.cells().item(row,2).comObject().numberFormat('@');
        xlsWorkSheet.cells().item(row,2).value(custTable.postalAddress().ZipCode);
        xlsWorkSheet.cells().item(row,3).comObject().numberFormat('@');
        xlsWorkSheet.cells().item(row,3).value(custTable.postalAddress().CountryRegionId);
        row++;

    }

    //Open Excel document
    xlsApplication.visible(true);
}
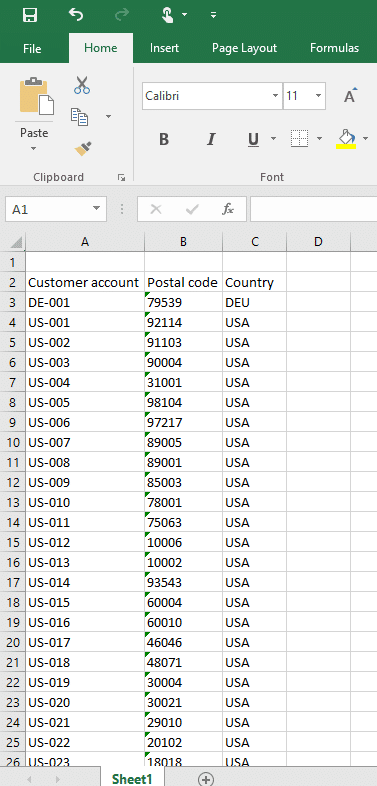
When this is run, Excel will populate with the desired data (NOTE: this demo is using the Dynamics A X 2012 R3 demo data within the USMF legal entity)
Step 2. Create the report
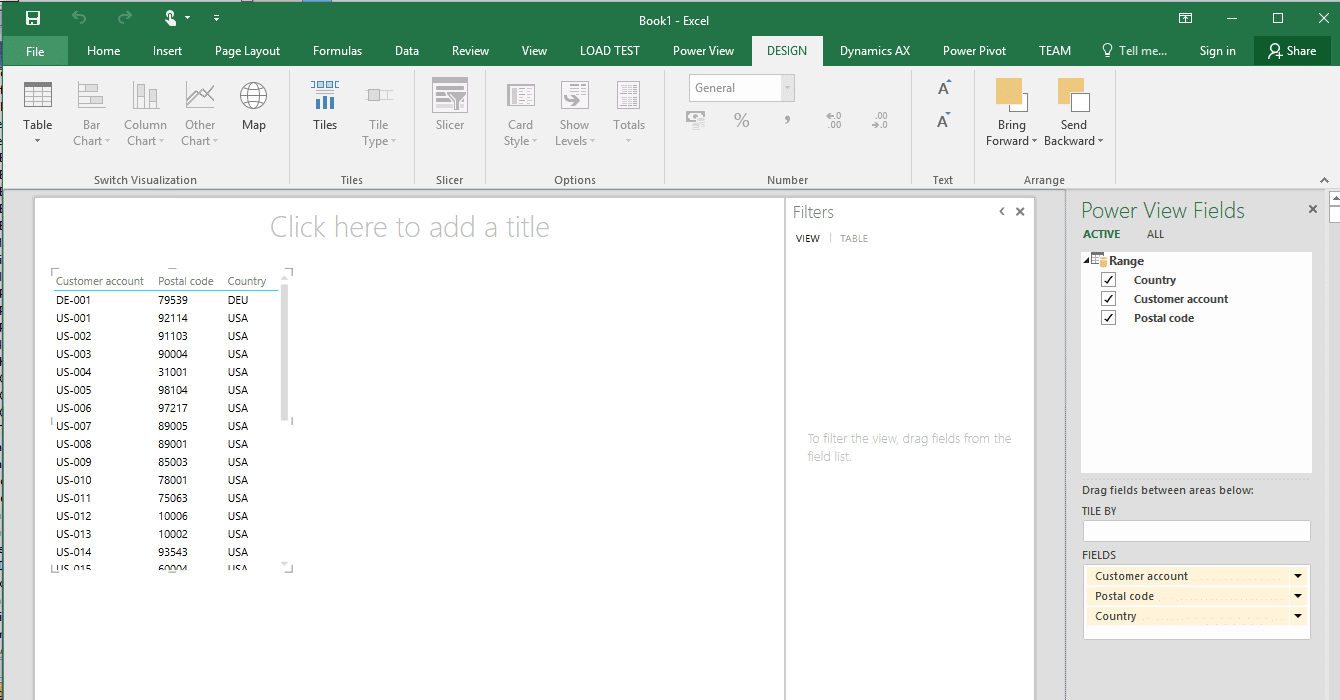
To create the report, Power View is used. When the Power View button is clicked, the following is displayed:
Click the Map button found in the Ribbon, and then resize the map that is displayed so it is more easily viewed:
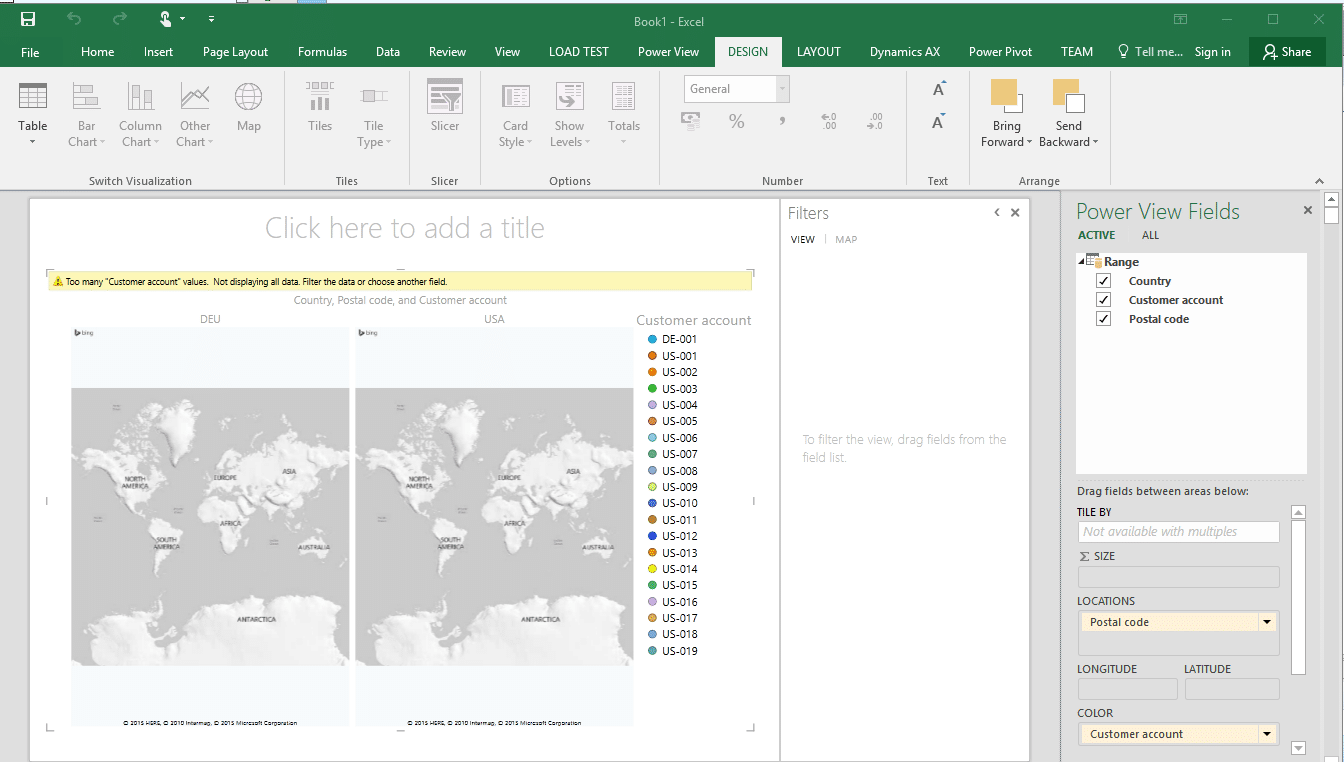
NOTE: You may get a message stating that the data may need to be geocoded. This is needed for the report to work as expected. This goes and used Bing maps for geographic data that will encoded and displayed on the map.
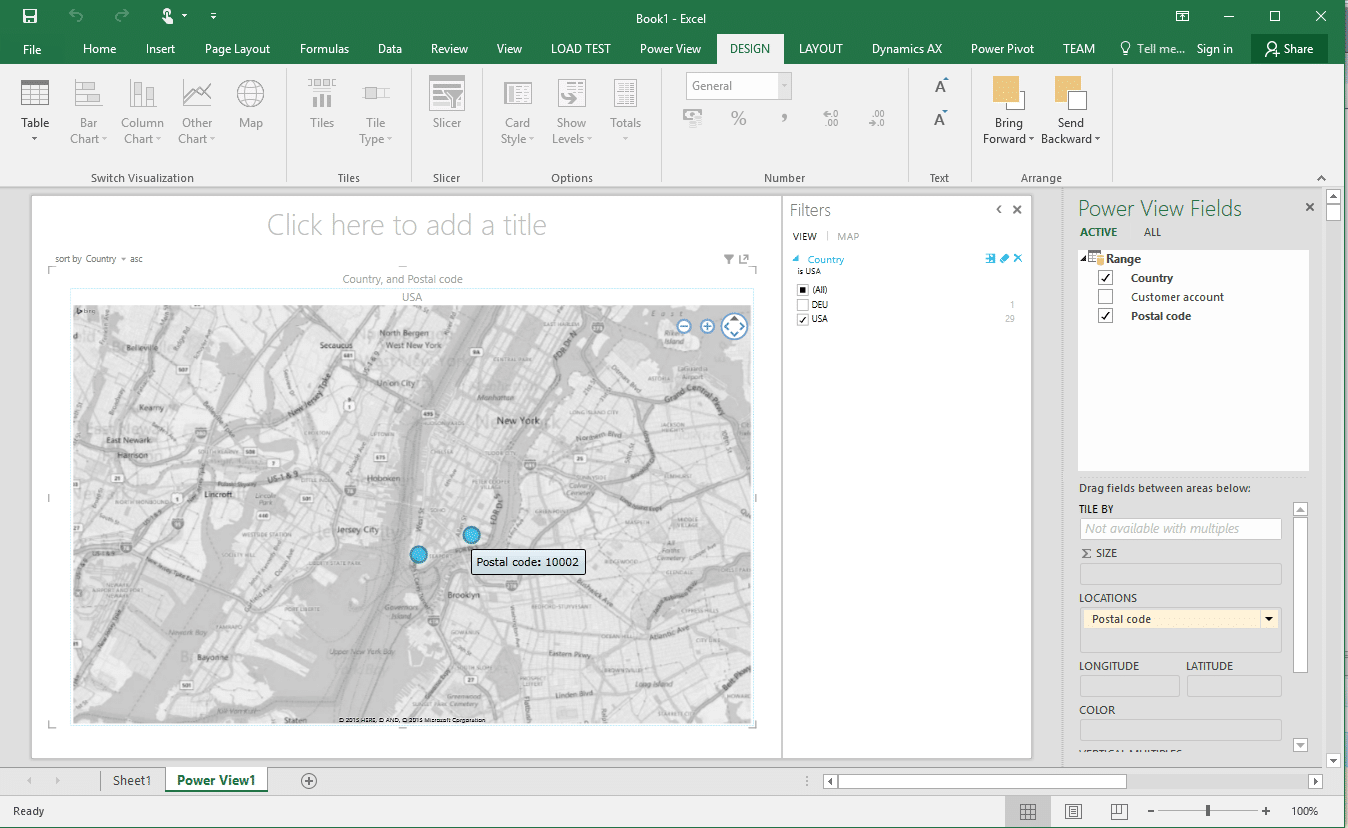
There is a message displayed stating that too many customer account values exist for this report. To remove this, simply uncheck the customer account field in the Power View Fields box. To filter by country, drag the country field into the filter area of the report. Select USA in the filter area, and a heat map displaying the locations of the USA based customers for the demo data is displayed:
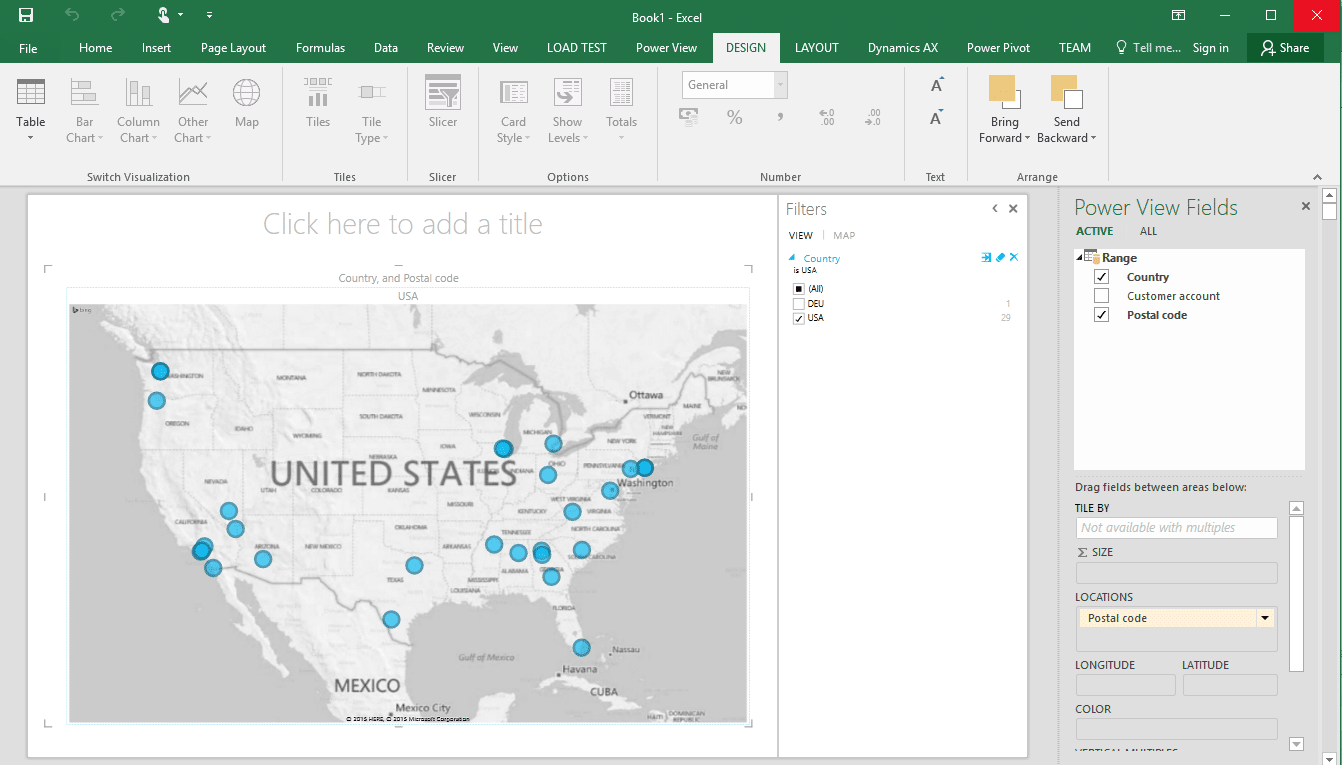
At this point, the mouse may be used on the map to zoom into different areas of the map for more detail.
I hope that this provides a little insight into how Dynamics AX 2012 data can be reported on with not much work within Microsoft Excel.

Under the terms of this license, you are authorized to share and redistribute the content across various mediums, subject to adherence to the specified conditions: you must provide proper attribution to Stoneridge as the original creator in a manner that does not imply their endorsement of your use, the material is to be utilized solely for non-commercial purposes, and alterations, modifications, or derivative works based on the original material are strictly prohibited.
Responsibility rests with the licensee to ensure that their use of the material does not violate any other rights.