


How to Configure Forecasting in Dynamics 365 Customer Engagement
Forecast Setup in Dynamics 365 Sales & Customer Engagement
Are you using the forecast feature in Dynamics 365 Sales or Dynamics 365 Customer Engagement? If you are there are some enhancements that came out in the Dynamics 365 Wave 1 2020 Release that make forecasting even better. If you are not using forecasting but want to, this blog will help you set it up.
When you set up and use forecasting in D365 Sales you give your users a way to track their performance against targets and help them identify issues that may hinder their ability to reach their targets. Management can also benefit from this tool by using it to provide coaching, anticipate sales, or change product strategy. With the new features in forecasting, projecting your revenue has never been easier. Let’s configure forecasting and look at some of the new features along the way.
Note: You must be a system administrator or have the Forecast Manager role to configure forecasts.
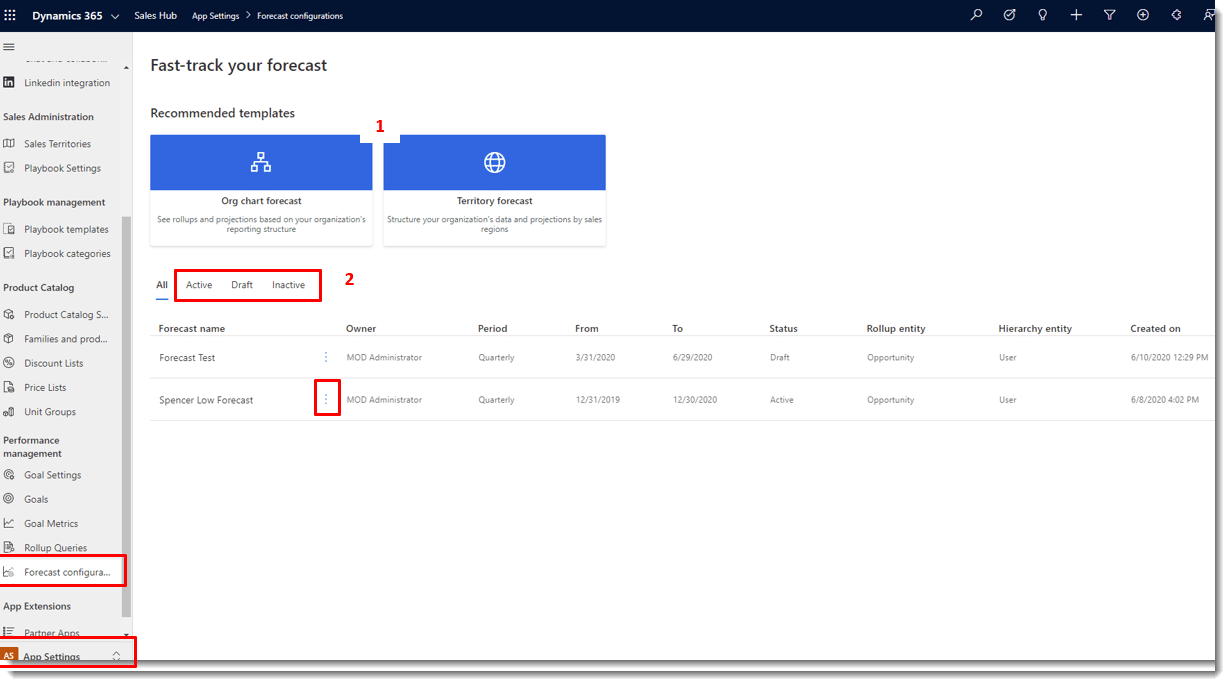
In the left-side navigation bar, navigate to App Settings then scroll down to Performance Management and select Forecast Configurations, here you will find the forecast configuration home screen (shown below).
- You can choose to configure your forecast with the Org chart template or with the Territory template by clicking on the one you want to use:
- The Org chart template is based on your reporting structure, it uses the Manager field on the User entity for the hierarchy
- Territory forecasts are based on your sales territory hierarchy
The Territory forecast option was added before the Wave 1 release so technically not a new feature and there may be a product-based forecast added soon so keep checking for that if interested.
- Below the Recommended Templates you will find a list of all your current forecasts:
-
- You can view them by Active, Draft and Inactive
- The More Options icon at the end of the forecast name gives you options to Edit, Deactivate or Delete the forecast
General Properties
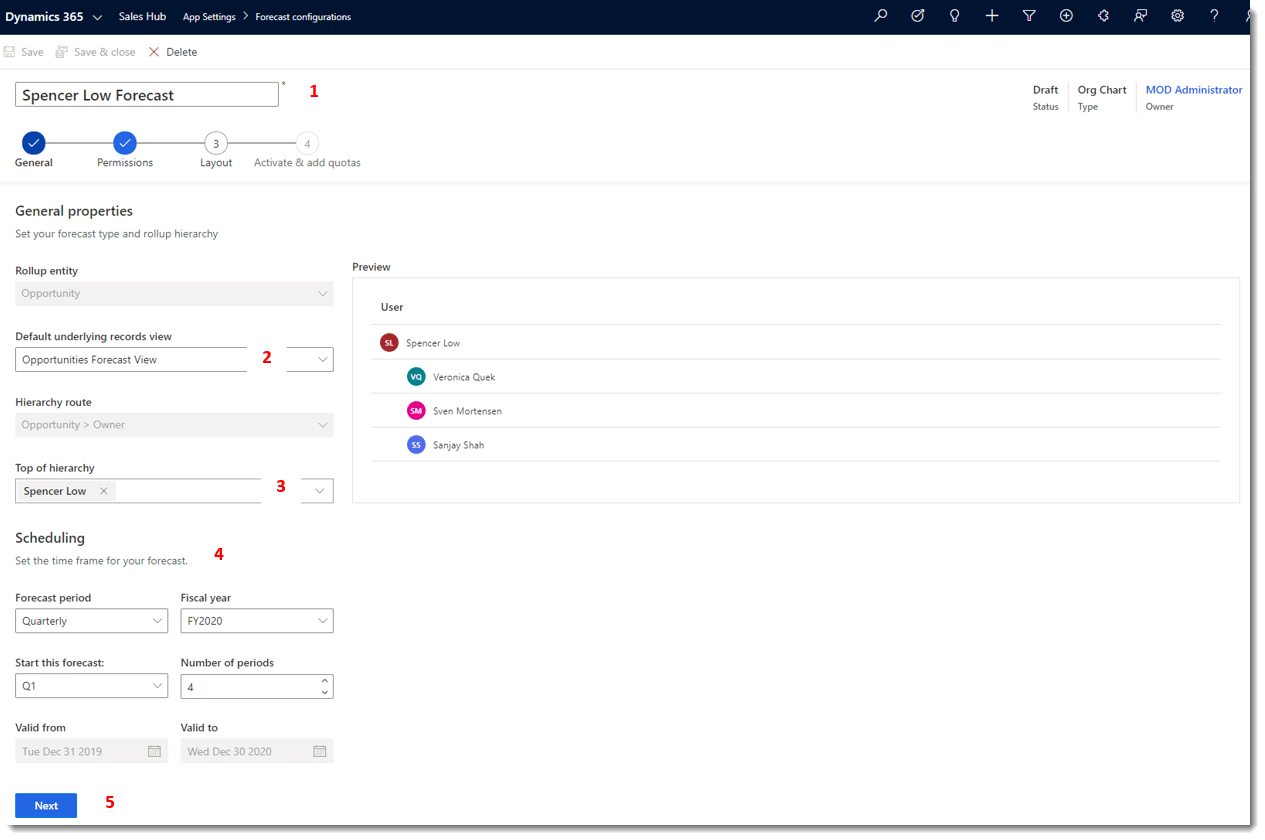
In this example, we have chosen the Org Chart Forecast template. The Forecast Configuration screen opens up as shown below.
- Give the Forecast a Name, being as descriptive as possible
- Select a Default underlying records view, this is the view that will show the opportunities that make up the forecast
- Lookup the user that will be the top of the hierarchy
- In the scheduling section specify the Forecast period, Fiscal year, Start this forecast and Number of periods - the valid from and to will auto-populate
- Select Next to move to the Permissions configuration
New Feature - Permissions
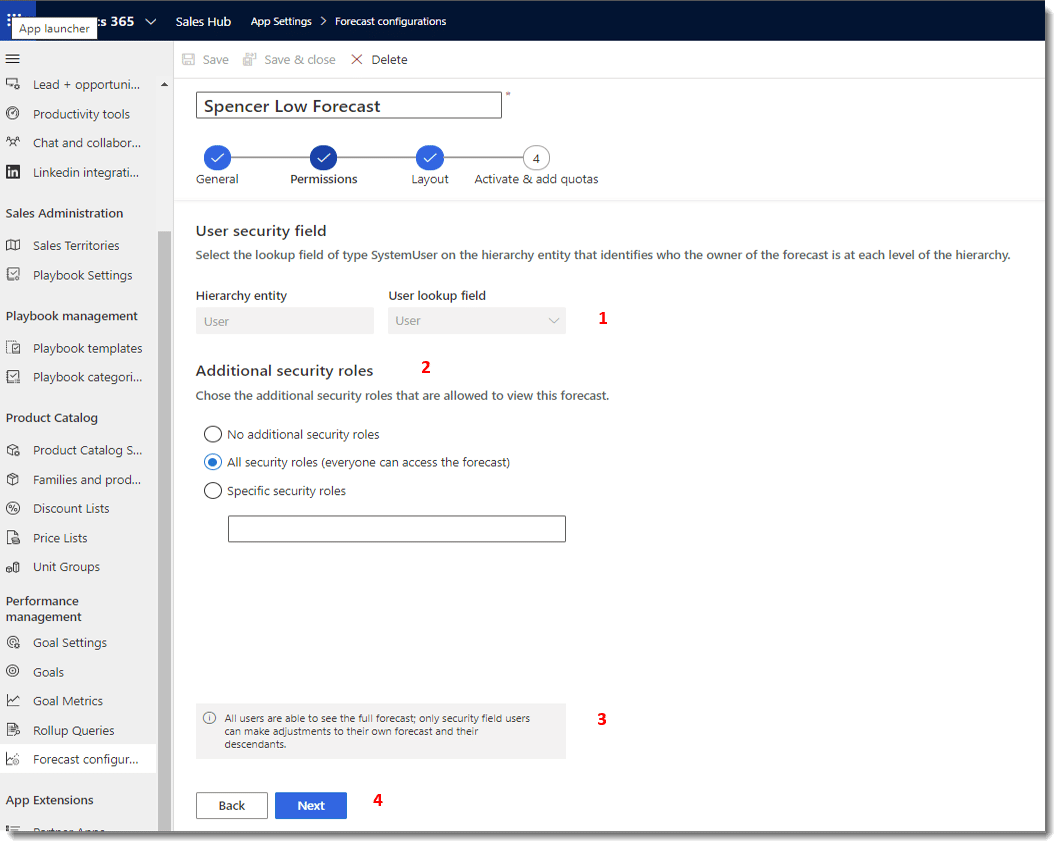
- The User lookup field is defaulted based on which template you chose at the very beginning of the setup:
- for the Org chart forecast, the value will be USER
- for the Territory forecast, the value will be MANAGER
- Under the Additional security roles section select the option that fits your needs:
- No additional security roles - only the selected hierarchy users see the forecast
- All security roles - all security roles in your organization see forecasts
- Specific security roles - allows you to choose the security roles that see the forecasts
- After you make your selection a message appears to help you understand your selection
- Select Next to move to the Layout and Column Configuration
Layout and Columns
This section is where we define the option set fields from the opportunity that can be configured for the forecast grid layout that your users will see.
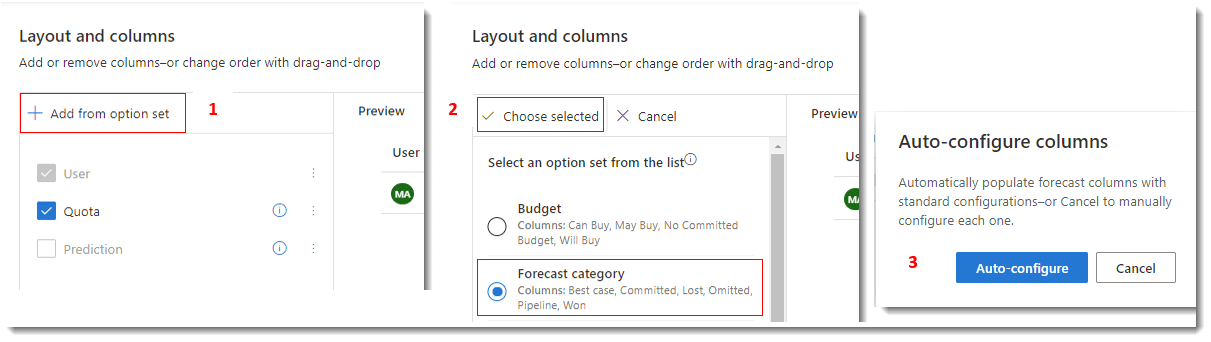
- In the Layout and Columns section, click the + Add from option set
- Chose an option set, (we recommend that you use the out-of-the-box Forecast category option set to begin with) and click Choose selected
- You will now see a preview of the columns and a window will open asking if you want to Auto-Configure the columns, click Auto-Configure
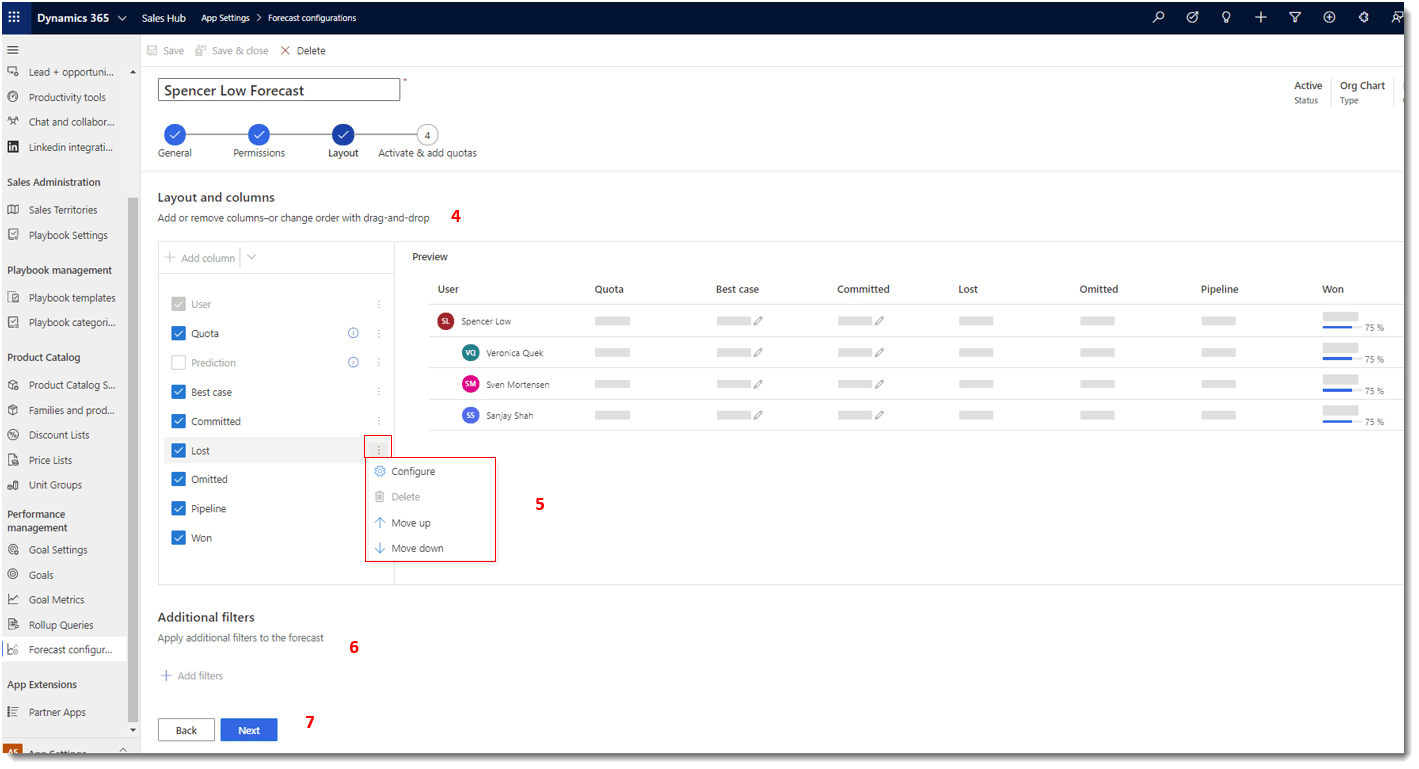
- You can add or remove columns by unchecking them or dragging and dropping them on the grid
- NEW FEATURE - You can also configure each column individually by clicking on the More Options icon and selecting Configure, in the configure option you can modify the column in several ways, the new feature here is that you can now configure a columns Type to be Roll-up or Calculated and we also now have the ability to manually adjust columns to fit your needs
- NEW FEATURE - Click on the + Add Filters button to filter out certain opportunities that are included in the forecast calculations
- Click Next to move on to the Activate and add quotas configuration
NOTE: The Prediction column is only available when predictive forecasting is enabled.
Activate and Add Quotas
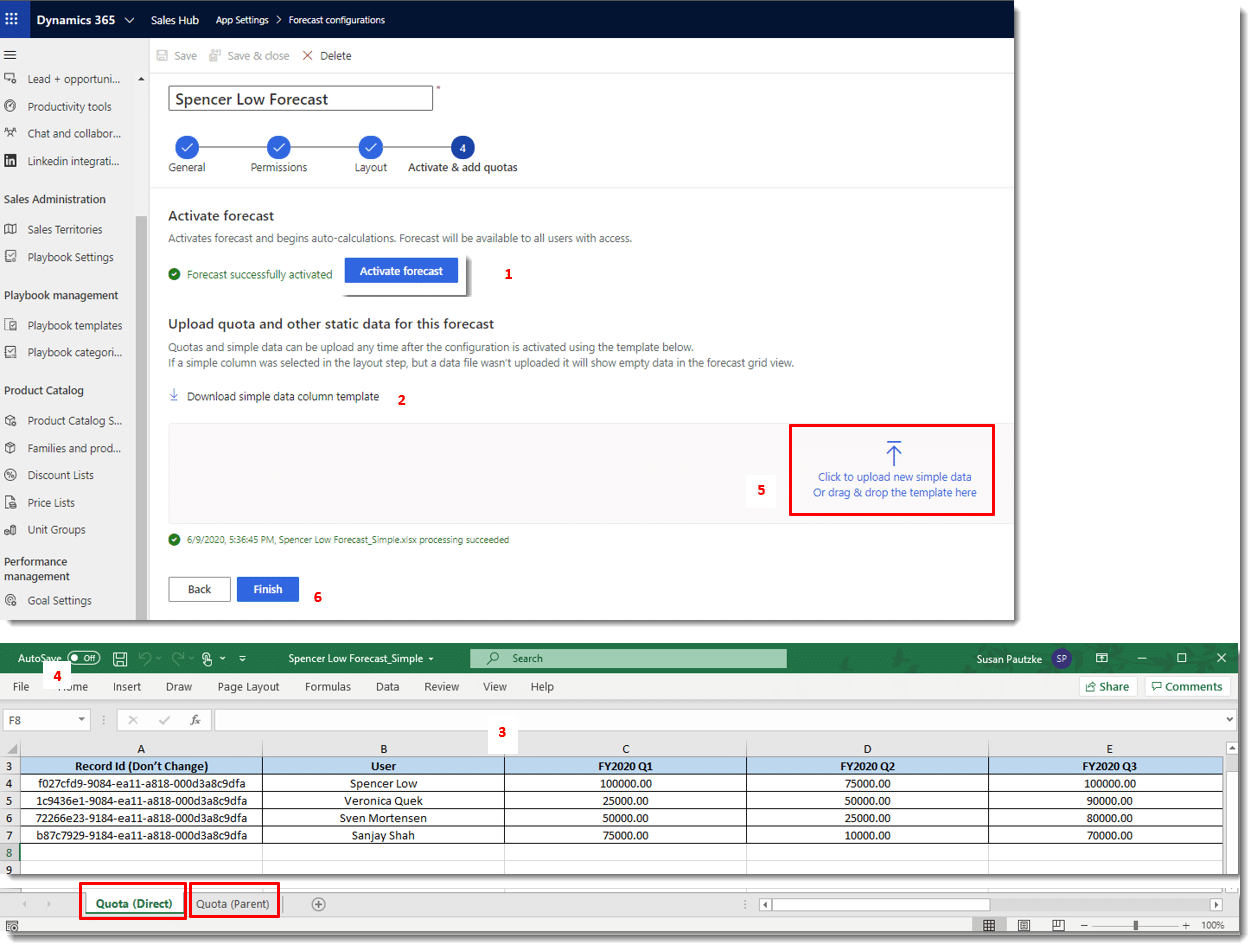
- Click on the Activate forecast button, this may take a few minutes. You will see the Forecast successfully activated message when it is done calculating
- In the Upload quota and other static data for this forecast section, you should see an option to Download simple data column template click on this to download a template (Excel Workbook) that shows the forecast time frame columns and the users in your hierarchy
- Open the quota template (Excel workbook), notice there are two tabs on the excel sheet one for Quota (Parent) and one for Quota (Direct), enter the quota data accordingly:
- Column (Direct) tab: shows all the sales reps or territories in your forecasting hierarchy
- Column (Parent) tab: shows anyone who has direct reports in the selected hierarchy
NOTE: Do NOT change the Record ID values in the workbook or your forecast will display inaccurate values.
- Save and Close your workbook
- In the Upload quota and other static data for this forecast section, choose the Click to upload or drag and drop your template here
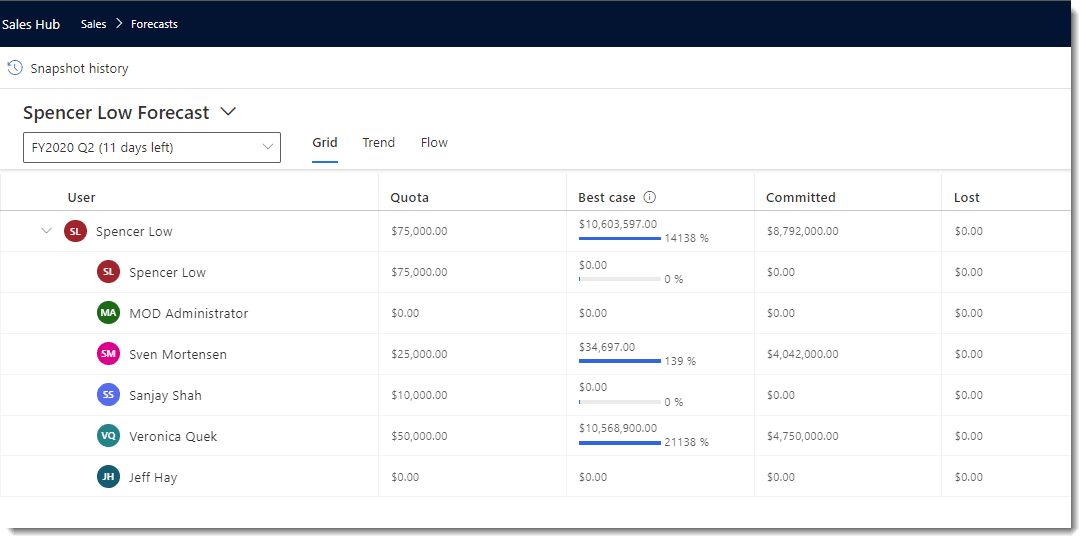
- Once the workbook is uploaded you should see a status message at the bottom, select FINISH and your forecast is ready to be viewed in the Sales area under the Performance section!
We hope you enjoy the forecasting feature in D365 CE and the recent enhancements that became available with the 2020 Release wave 1 update and look for future blogs on using the forecasting feature. Please reach out to our Stoneridge Software Team for any questions you may have on setting up or using this feature in your organization!

Under the terms of this license, you are authorized to share and redistribute the content across various mediums, subject to adherence to the specified conditions: you must provide proper attribution to Stoneridge as the original creator in a manner that does not imply their endorsement of your use, the material is to be utilized solely for non-commercial purposes, and alterations, modifications, or derivative works based on the original material are strictly prohibited.
Responsibility rests with the licensee to ensure that their use of the material does not violate any other rights.