


Leveraging Reporting Tools in Dynamics GP to Effectively Manage Data
You can set up and use several great reporting tools in Dynamics GP to analyze data quickly to make informed decisions for your organization.
These tools can help you generate crucial financial and operational insights that can help you forecast and guide how you and your business move forward across multiple sectors.
In this blog, we’ll explore the powerful reporting tools available within Dynamics GP, the advantages of external solutions, and how you can harness the potential of your GP data for better business performance.
Built-In Dynamics GP Reporting Tools
Dynamics GP offers multiple reporting tools that allow users to access, analyze, and share business data. From general ledger (GL) reports to in-depth financial analyses, these tools support users across departments in generating actionable insights.
Here’s an overview of key reporting tools you can use to maximize data usage:
Management Reporter
A free tool included with GP, Management Reporter is primarily used for financial reporting, such as creating balance sheets, income statements (P&Ls), and cash flow statements. It enables businesses to pull data directly from their general ledger to create various financial reports.
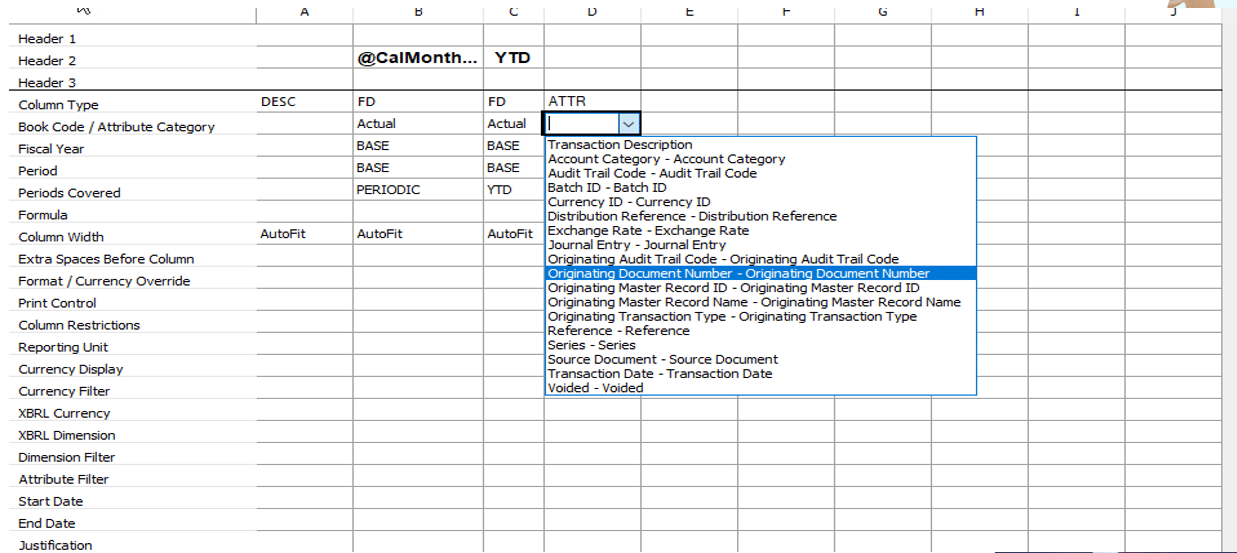
Users can further enhance their reports by adding company logos or specific attributes, such as vendor IDs or batch IDs, to make them more relevant and visually appealing.
SmartLists
SmartLists are a popular tool in Dynamics GP. They allow users to access data across various modules, including financials, purchasing, sales, and inventory. Users can easily filter, sort, and export SmartLists to Excel for further analysis. One of the key benefits of SmartLists is their customizability.

You can add or remove columns, apply search filters, and even save customized SmartLists as favorites for easy access. This tool provides flexibility and efficiency, making it ideal for users looking for quick insights.
Navigation Lists
Like SmartLists, Navigation Lists help users view and filter GP data. They allow users to create customized lists (e.g., vendor or customer lists), which can be tailored by adding specific columns and applying filters. For instance, if you want to create a vendor list that includes certain fields like vendor type or postal code, you can customize the navigation list accordingly.

Navigation Lists are a user-friendly way to work with data, especially when handling day-to-day operations like managing vendor details or viewing sales orders.
Excel-Based Reports

Dynamics GP includes built-in Excel-based reports that allow users to pull data directly from GP into an Excel spreadsheet. Many users prefer this because they like how easy it is to use Excel to manipulate data. Reports like trial balances or financial statements can be exported into Excel for further analysis or presentation, providing users with an adaptable platform to dive deeper into their data.
Dexterity-Based Reports and SQL Reporting Services (SRSS)

These tools allow more technical users to generate custom reports directly from GP’s database. Dexterity-based reports are generated from within GP, while SQL Reporting Services provides more advanced users with the ability to create server-side reports. While not as intuitive as other tools, these reporting options offer powerful solutions for those with the necessary technical knowledge.
External ISV-Based Reporting Tools
Beyond GP’s native reporting capabilities, external Independent Software Vendor (ISV) solutions can enhance Dynamics GP’s reporting functions. Some of the most notable options include:
- Vivid Reports
- Jet Reports
- Active Reporter
All three tools are Excel-based, allowing users to generate reports using familiar formulas and functions. Johnson emphasizes the versatility of these tools, which let users pull data from GP’s general ledger tables directly into Excel for seamless analysis. While these tools come with additional costs, they offer enhanced flexibility and customization for users who need more robust reporting capabilities.
Using Power BI in Dynamics GP
In recent years, more organizations have turned to Power BI for their reporting needs. Power BI is a powerful business analytics tool that helps users visualize data, create custom dashboards, and generate interactive reports.

A key capability of Power BI is how it pulls data from multiple sources, including Dynamics GP. This allows businesses to combine their GP data with other business data, offering a more comprehensive view of organizational performance.
The main challenge you’ll face is understanding how different data sets interact. However, once you overcome that, you will find that Power BI has tremendous capabilities.
With Power BI, users can create sophisticated visual reports, track KPIs, and predict future trends using AI and machine learning. It also supports sharing reports across teams, improving collaboration, and decision-making at every level of the organization.
Choosing the Right Tool for Your Business
Given the variety of reporting tools available for Dynamics GP, it’s important to understand which tools best suit your business needs. Here are a few factors to consider:
- Reporting Complexity: If your business only requires basic financial reporting, tools like Management Reporter or SmartLists may be sufficient. However, for more complex reporting, such as multi-company consolidations or advanced financial analytics, you can use Jet Reports or Power BI.
- User Expertise: Tools like Management Reporter and SmartLists are relatively user-friendly, making them ideal for non-technical users. However, more advanced options like Dexterity-based reports or SRSS require technical expertise and are best suited for organizations with dedicated IT or reporting teams.
- Customization Needs: If your business requires highly customized reports, external ISV tools such as Active Reporter or Vivid Reports offer greater flexibility in building tailored reports that meet specific business requirements.
- Real-Time Analytics: For organizations that need real-time insights, especially in a cloud-based environment, Power BI is an excellent choice. It offers powerful data visualization and reporting features that help businesses monitor performance and track KPIs in real time.
Maximize Dynamics GP’s Data Potential by Partnering with Stoneridge Software
Stoneridge has a team of experts who can help you optimize your Dynamics GP environment and get the most out of your data.
Get in touch today to learn more.

Under the terms of this license, you are authorized to share and redistribute the content across various mediums, subject to adherence to the specified conditions: you must provide proper attribution to Stoneridge as the original creator in a manner that does not imply their endorsement of your use, the material is to be utilized solely for non-commercial purposes, and alterations, modifications, or derivative works based on the original material are strictly prohibited.
Responsibility rests with the licensee to ensure that their use of the material does not violate any other rights.